Curated OER
x- and y-Intercepts
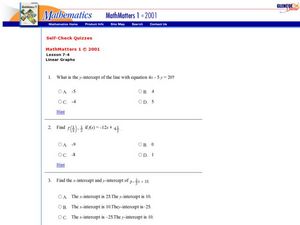
In this x- and y-intercepts worksheet, 9th graders solve and graph different problems related to linear equations. First, they determine the x- and y-intercepts by plugging in 0 for each and solving. Then, students find at least one more...
Curated OER
When Will We Ever Use This? Predicting Using Graphs
Here are a set of graphing lessons that have a real-world business focus. Math skills include creating a scatter plot or line graph, fitting a line to a scatter plot, and making predictions. These lessons are aimed at an algebra 1 level...
Curated OER
Rational Functions
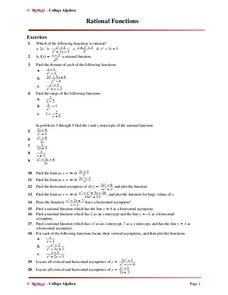
In this rational functions activity, students identify rational functions. They find the domain and range of each function. Students find the x and y-intercepts of functions. This two-page activity contains 35 multip-step problems.
Curated OER
Lessen the Loan
Middle-schoolers explore the concept linear equations. They use the internet to navigate through videos and problems. Pupils problem solve to determine rates of change, slope, and x and y-intercepts.
Curated OER
Famous People: Teacher Notes
Young statisticians practice creating scatter plots. First, they estimate the age of 14 people. Next, they write down the estimate in a table labeled x. Then write down their actual age in the table labeled y. Using these x and y...
Curated OER
X & Y Coordinates
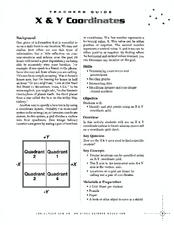
Students identify and plot points. In this graphing lesson, students use an X and Y coordinate grid to locate missing spacecraft on a coordinate grid sheet.
Curated OER
Plotting Coordinates on a Grid
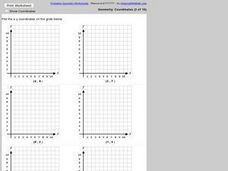
In this plotting points on a graph worksheet, students plot 6 points on 6 graphs. Students plot x and y-coordinates in the first quadrant.
Curated OER
Stars and Slopes
More of a math lesson than physics or space science, high schoolers take a set of data and plot it on a log-log coordinate system. The write-up for day two was never completed, but day one, "Stars and Slopes," is complex and cohesive....
Curated OER
More on Graphing Linear Equations
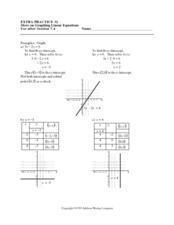
In this graphing worksheet, students graph linear equations, identify the x or y-intercept. Graph paper is provided below each equation. There are nine problems on this two-page worksheet.
Curated OER
Linear Equations
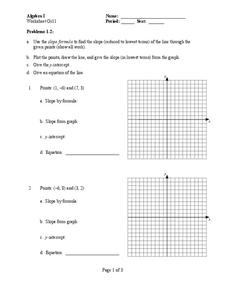
For this Algebra I worksheet, 8th graders write the equation of a line given two points and given a linear equation determine the slope, x-intercept, y-intercept, and graph the line. The five page worksheet contains ten problems. ...
Curated OER
Linear Equations
In this Algebra I worksheet, students determine the graph of the equation of a line. Students determine the x- and y-intercepts and graph. The three page worksheet contains six problems. Answers are not provided.
Curated OER
More On Graphing Linear Equations
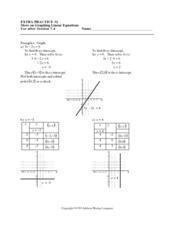
In this linear equation worksheet, students graph linear equations and identify the x or y-intercept. There are nine graphing equations on this two-page worksheet.
Curated OER
More Graphing With Intercepts
In this graphing worksheet, students graph linear equations. They identify the x or y-intercept. Coordinate planes are available below each equation. Nine problems are provided on this two-page worksheet.
Curated OER
Hands On: Plot Points on a Coordinate Grid
In this solving coordinate grid word problem worksheet, learners plot points, order pairs, identify horizontal and vertical lines, and find distances to solve problems. Students solve six problems.
Curated OER
Lesson 6-7: Scatter Plots and Equations of Lines
In this scatter plot worksheet, students examine tables and write a linear equation that matches the table. Students graph linear equations. They read scatter plots, determine the trend line, and write a linear equation to match...
Curated OER
Graphing Ordered Pairs
Are you working on graphing ordered pairs in your class? In this worksheet, learners, after looking over and studying how to graph ordered pairs, plot points on a coordinate grid and connect the dots. Class members also identify what...
Curated OER
Data Collection and Presentation
Middle and high schoolers collect and analyze data from four different activities. The activities include information about classmates, tallying colors of cars in a parking lot, stem and leaf plots, and making a histogram from winning...
Inside Mathematics
Population
Population density, it is not all that it is plotted to be. Pupils analyze a scatter plot of population versus area for some of the states in the US. The class members respond to eight questions about the graph, specific points and...
Inside Mathematics
Snakes
Get a line on the snakes. The assessment task requires the class to determine the species of unknown snakes based upon collected data. Individuals analyze two scatter plots and determine the most likely species for five additional data...
Curated OER
Scatterplots and Regressions
In this scatterplots and regressions worksheet, students solve 6 different types of problems related to graphing scatterplots and interpreting regressions. First, they create a scatterplot from the given data coordinates and then,...
Curated OER
Graphing
In this graphing worksheet, students solve and graph 10 different problems that include determining various coordinates and the slope. First, they use the table to write the x and y coordinates for each point on the graphs. Then,...
Curated OER
Graphing Greenery
Students gather leaves and trace them on graph paper. They plot coordinates that approximate the shape of the leaves and share those coordinates as "worksheets" for other students to complete.
Teach Engineering
Coordinates and the Cartesian Plane
The plot thickens to get a functional understanding. After a short review of plotting points on the coordinate plane, class members learn the difference between functions and relations in the second lesson in a series of nine. They show...
Concord Consortium
Function Project
What if a coordinate plane becomes a slope-intercept plane? What does the graph of a linear function look like? Learners explore these questions by graphing the y-intercept of a linear equation as a function of its slope. The result is a...


