Curated OER
Close to Home
Fourth graders examine habitats for animals by creating their own in class environment. In this environment lesson, 4th graders research the Internet for information on certain wild animals and the places in which they live....
Curated OER
Sea and Ice Salinity
Students conduct an experiment. In this salinity lesson, students learn about sea ice, why it is important and how changing amounts can affect the sea. Students conduct an experiment to find out the effects of salinity on the...
Curated OER
A Readers' Theatre for Bringing the Rain to Kapiti Plain
Second graders read and perform a reader's theater version of the story, "Bringing the Rain to Kapiti Plain." They complete a graphic organizer of cause and effect of their part in the story, look up vocabulary words on a dictionary...
Curated OER
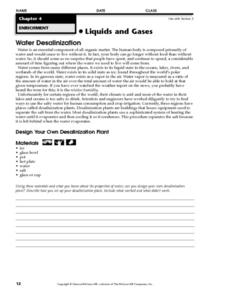
Water Desalinization
In this water desalinization worksheet, students will design and construct their own desalinization plant. Then they will describe how they set up their experiment and if it worked or not.
Curated OER
Global Meltdown
In this environmental science lesson, students study data and animation on global temperature increase to complete 8 short answer questions that follow.
Curated OER
Mystery of the Megaflood
Students will use everyday items and speeds to describe the dimensions of a massive flood that occurred in the Pacific Northwest near the end of the last ice age.
NASA
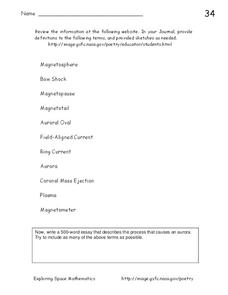
Auroras
In this auroras worksheet, students define 11 terms related to space phenomena such as auroras, coronal mass ejections and auroral ovals. Students use a given website to help them define the terms and they write a 500 word essay about...
Curated OER
Getting to the Core of Climate Change
Young scholars investigate climate changes by graphing and analyzing ice core data from Greenland and Antarctica. They create, explain and report the pattern of data on a graph of ice core data. In addition they find relationships...
Curated OER
Avalanche on Mars!
In this mars and scaling instructional activity, students use the given image to determine the dimensions of the image and the size of specific details on the image. They calculate the image scale in meters in order to determine...
Curated OER
Magnetic Energy
In this magnetic energy worksheet, students are given the formula to calculate the magnetic energy of an object. They use the formula to solve for the magnetic energy of the Earth, a geotail, the Sun, and a solar prominence given their...
National Energy Education Development Project
Introduction to Wind Energy
The U.S. produced enough wind energy in 2015 to power all of the homes in Alaska, California, Delaware, the District of Columbia, Hawaii, Idaho, Maine, Montana, Nebraska, New Hampshire, North Dakota, Rhode Island, South Dakota, and...
Curated OER
Surface Air Temperature Trends of the Caribbean
Students use real satellite data to determine the changes in near-surface air temperature at different times of the year over the Caribbean Sea. They discover how Earth's tilt causes seasonal differences in incoming solar energy. They...
Curated OER
Exploring Biomes Lesson 1: Mapping Biomes
Environmental science learners examine satellite imagery of temperature, vegetation, precipitation, and productivity. They use these maps to understand how scientists divide the planet into major biomes. As part of a larger unit on...
Curated OER
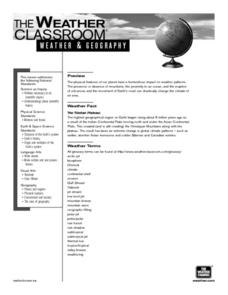
The Tibetan Plateau
Learners discuss the characteristics of the biosphere, with a focus on the Tibetan Plateau. They participate in a question and answer period discussing biomes and climate patterns. They compare and contrast different ecosystems.
Southwestern Medical Center
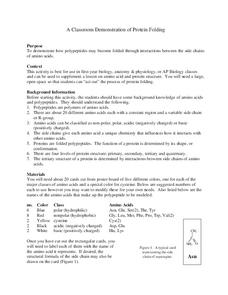
A Classroom Demonstration of Protein Folding
Does the mention of proteins and polypeptide relationships in your classroom result in mass confusion? Does the attempt to teach this important concept generate multiple questions and, at times, lead to a room filled with blank...
Polar Trec
Mini-Ocean Bathymetric Mapping Research Cruise
Middle or high schoolers transform into oceanographers in a week-long simulation. To begin, each group follows directions to create a model of the ocean floor with specified features. Next, the groups prepare to set sail on a research...
Curated OER
Plankton Parade
Plankton isn't just a tiny cartoon character, it's also a very important food source for animals around the world. Budding scientists discuss the types and functions of plankton, including where they are found, how they are caught, and...
Curated OER
Creating Climographs
Students use satellite data to compare precipitation and surface temperatures on different islands. In this satellite lesson plan students create graphs and explain the differences between weather and climate.
Curated OER
Matrix Madness!!
Perform operations to add, subtract, multiply and divide matrices. Then solve problems with vectors using matrices. A three day lesson: Matrix Madness, Mystical Matrices, and Decode the Encode. The last lesson has prizes that the class...
American Museum of Natural History
Climate Change
It actually is possible to have too much of a good thing when it comes to climate change. A slide show lesson describes how burning fossil fuels contributes to climate change. Individuals read about the scientific process and the...
Curated OER
Bellwork for Week 16-Climate
In this bellwork activity, students answer a variety of questions about the climate, climographs, biomes and factors that control climate.
Curated OER
Habitats and All That
First graders read books, complete online explorations and discuss the ways in which animals adapt to their habitats in order to survive. They create accordion books, play matching games and dramatize animal adaptations.
Curated OER
Ice is N"ICE"!!
Students observe and describe, both orally and in writing. the different forms of water on the surface of the Earth and measure the approximate size of an iceberg. They also estimate and measure the amount of ice that floats above the...
Curated OER
Snow Cover By Latitude
Students create graphs comparing the amount of snow cover along selected latitudes using data sets from a NASA website. They create a spreadsheet and a bar graph on the computer, and analyze the data.
Other popular searches
- North Polar Regions
- Polar Regions Thematic Unit
- Polar Regions Games
- Polar Regions Grade K 2
- Polar Regions Art Work
- Global Warming Polar Regions
- Polar Regions Lesson Plans
- Graphing the Polar Regions
- Polar Regions 3 D Projects


