US Department of Commerce
Constitution Day
Give your Constitution Day celebration a timely slant by discussing the census! An activity that includes analysis of the Constitutional call for a census, along with scaffolded worksheets, help pupils understand the connection between...
Mathalicious
Pandemic
Young scientists use exponential growth and logarithms to model how a virus spreads through a population. Pupils watch a news clip about the 2012 outbreak of Ebola. Scholars then manipulate inactive graphs to see how various factors...
National Institute of Environmental Health Sciences
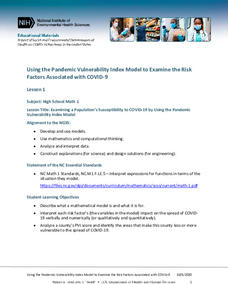
Lesson 1: Using the Pandemic Vulnerability Index Model to Examine the Risk Factors Associated with COVID-19
How vulnerable are you to COVID-19? High school mathematicians use the Pandemic Vulnerability Index to create models that help them collect and analyze data about the risk factors associated with COVID-19. After investigating four groups...
National Institute of Environmental Health Sciences
A Student Exploration of the Impacts of Climate Change on Human Health in the United States
Let the data drive the science. Learners examine data provided in resources to discover connections between climate change and health of vulnerable populations. They study trends and present findings using their choice of projects.
Workforce Solutions
Miniature Gulf Coast Project
Scholars show what they know about data collection and analysis with an activity that examines a smaller population of Houghton, Texas. Independently or in pairs, learners identify their research question, gather, graph, and analyze...
Penguin Books
A Teacher's Guide to the Signet Classic Edition of William Shakespeare's Twelfth Night
With the help of this teacher's guide, it won't take 12 nights for scholars to complete their study of William Shakespeare's romantic comedy about twins Viola and Sebastian. Pompous prigs, he shes, fatuous fools, and lovelorn lovers...
Penguin Books
A Teacher's Guide to the Signet Classic Edition of William Shakespeare's Othello
Villains populate literature. These dastardly characters serve as a contrast to the hero who they set out to destroy. Iago, the villain of Shakespeare's tragedy Othello, certainly rates as one of the most despicable. Motivated by...
California Academy of Science
Color Vision Genetics Evolution Simulation
At one point, all mammals carried only two color receptors, but now most humans carry three. An informative presentation and hands-on activity demonstrate how this evolved through genetics. By participating in the activity, pupils...
Curated OER
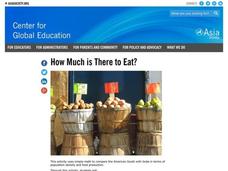
How Much is There to Eat?
Students examine food production related to population density. In this interdisciplinary lesson, students gather data regarding food production in the American South and in India. Students follow the outlined steps to calculate the...
Curated OER
Worksheet 1
In this math worksheet, pupils describe the difference between a partial and an ordinary differential equation. They give examples of 1st, 2nd, and 3rd order differential equations. Students apply this information to predator/prey...
Curated OER
Evidence of Democratic Principles and Multiculturalism in Our Schools
In small groups of 3-4, explore one of the special population categories here. Each member of the group should visit every site within the special population category chosen. Then group members should come together to discuss/respond to...
Curated OER
Capture/Recapture
Students use proportions to estimate the size of populations. They describe the data with using a graph or table of the estimate. Students use descriptive statistics to calculate mean, median, and mode. They also compare and contrast an...
Curated OER
Patterns of Evolution and Selection
Can your young biologists interpret population graphs, match macroevolution patterns and descriptions, and answer multiple choice questions about evolution? Find out with a comprehensive three-page quiz covering some specific examples of...
Curated OER
Cartogram of the Great Compromise
Young scholars create cartograms of populations during 1790.
Curated OER
Endangered Species
Ninth graders graph data in order to compare the number of extinct species and a rise in human population. They analyze the data collected. Students are encouraged to infer the relationship.
Curated OER
Pre-Activity Worksheet: Natural Selection
Although the instructions include reading from a specific textbook, the tasks are appropriate for any unit dealing with how genotype frequency changes over time. Junior biologists define five vocabulary terms and then answer five...
Illustrative Mathematics
Why Randomize?
Your statisticians draw several samplings from the same data set, some randomized and some not, and consider the distribution of the sample means of the two different types of samplings. The exercise demonstrates that non-random samples...
Curated OER
Through the Looking Glass: Recognizing Developing and Industrialized Countries
Young scholars examine the regions of the world, and identify the basic characteristics of industrialized and developing countries. They conduct Internet research on the economic and population characteristics of industrialized and...
Curated OER
Marvelous Manatees
Two groups consider whether or not the Florida manatee will become extinct during their lifetimes. They research manatee populations and statistics together and then a class debate is held. Afterwards they consider how reliable...
Curated OER
What in Our World Affects the Way People Live
Sixth graders study various maps that show geographical features and population. They compare the maps and make inferences about how various geographical features influence the population and human activities of an area.
Curated OER
What's Russia To Do?
Pupils watch a PowerPoint presentation on the Gulag system in Russia. In groups, they use the internet to create maps on climate and population pyramids for the country of Russia. They must use this information and develop a plan to...
Curated OER
Mice Rule!
Students explain what biodiversity is and how adaptive features are maintained in a population. In this biodiversity lesson students complete a simple activity involving mouse populations.
Curated OER
Protecting Philippine Reefs
Students watch a slide show about the Philippine Reefs to explore the topic of fish populations. In this reef and fish population lesson, students watch a slide show about fish populations and how the Peace Corps works...
California Academy of Science
Sustainable Fishing in the Philippines
Understanding the importance of sustainable fishing practices is fostered through a classroom game. In small groups, the class plays a fishing game where they can see first-hand, the effects of thoughtless fishing practices. After the...
Other popular searches
- Population Ecology
- Population Genetics
- Population Density
- Population Biology
- Population Growth
- Population Geography
- Human Population
- World Population
- Population Distribution
- Aging Population
- Populations and Ecosystems
- Human Population Growth


