EngageNY
Using Sample Data to Compare the Means of Two or More Populations
Determine whether there is a difference between two grades. Teams generate random samples of two grade levels of individuals. Groups use the mean absolute deviation to determine whether there is a meaningful difference between the...
Curated OER
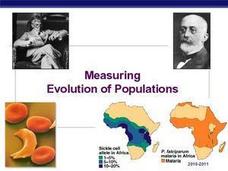
Measuring Evolution of Populations
The five agents of evolutionary change are reviewed in this slideshow. Definitions of common terms involved with populations and equilibrium are given, and there are some presentations of Hardy Weinberg equations for common examples of...
Curated OER
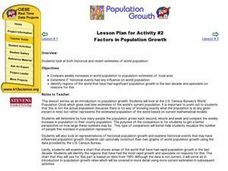
Factors In Population Growth
Students examine both historical and recent estimates of world population. They identify regions of the world that have had significant population growth in the last decade and speculate on reasons for this.
Education World
The African American Population in US History
How has the African American population changed over the years? Learners use charts, statistical data, and maps to see how populations in African American communities have changed since the 1860s. Activity modifications are included to...
PBS
Population Simulation with M&M's
Math and M&Ms® go great together when introducing a modeling activity. Allow your learners to simulate population growth and decay of fish in a pond and share their reasoning for the change in fish. With such an impact we have on our...
Inside Mathematics
Population
Population density, it is not all that it is plotted to be. Pupils analyze a scatter plot of population versus area for some of the states in the US. The class members respond to eight questions about the graph, specific points and...
Florida International University
Counting FishStix
How do we count the fish in the ocean? An engaging lesson models how to estimate fish populations with observational surveys. Class members begin by studying the behavior of fish on the coral reef in the oceans. They then become the fish...
EngageNY
Using Sample Data to Estimate a Population Characteristic
How many of the pupils at your school think selling soda would be a good idea? Show learners how to develop a study to answer questions like these! The lesson explores the meaning of a population versus a sample and how to interpret the...
US Department of Commerce
Featured Activity: Population Change Over Time
Keep track of a state's population. After a brief discussion on how population data is used for funding, individuals look at population changes over time. Pupils find the population of two states using three different censuses. They then...
Curated OER
Populations
Take your ecology aces out in the field to practice population counts and model the benefits of camouflage. Though not particularly exciting, these activites and the assessments that are also included are practical and applicable to your...
Curated OER
How Many Frogs?
Students explore the concept of linear regression. In this linear regression lesson, students find the line of best fit for a set of data pertaining to a frog population. Students use their line of best fit to predict the frog population...
EngageNY
Population Problems
Find the percent of the population that meets the criteria. The 17th segment of a 20-part unit presents problems that involve percents of a population. Pupils use tape diagrams to create equations to find the percents of subgroups of the...
Teach Engineering
Biomes and Population Dynamics - Balance Within Natural Systems
How large can a population become? The fifth installment of a nine-part unit teaches young ecologists about limiting factors that determine the carrying capacity of species in the Sonoran Desert. Here is a PowerPoint to help present this...
Digital History
Representation: By State or by Population
Should representation in the new United States government be based on population? This worksheet illustrates the details of this important quandary through an adaptation of speeches on the topic given at the Constitutional Convention....
US Department of Commerce
Featured Activity: Let’s Get the Count Right
Don't leave anyone out. To highlight the importance of the US Census to younger learners, an activity has them distribute markers to see if there are enough for each person. They see that counting the population is necessary to fairly...
National Wildlife Federation
How Many Bison?
Math and science to the rescue! Some basic math concepts help scientists predict wildlife populations. Using tokens, groups simulate tagging a wildlife population. They then use proportions to estimate the population of the wildlife.
Curated OER
Displaying Populations: Jellybeans, Paper and People
Students investigate the factors affecting population growth. In this biology lesson, students collect data from the lab and graph them. They estimate population size using a mathematical formula.
Curated OER
Population and Air Pollution
Students conduct Internet research to compare the impact of increasing populations and how it affects air pollution in both, the USA and Russia. Students present their finding in a creative manner by developing brochures, bumper...
Curated OER
How Do Populations Grow?
Students examine how populations grow and how invasive species can affect the balance of ecosystems. They simulate the growth of lily pads, analyze and record the data, and simulate the results of an invasive species on an ecosystem.
Curated OER
How Many Is Too Many?
Students explore the population explosion. They view a video depicting the exponential growth of human population. Students research the internet to project future population data. They perform hands-on, multimedia activities to study...
Curated OER
Why We Count
Learners visualize census data on a map and use a map key to read a population map. In this census lesson, students use a map of the Virgin Islands and corresponding worksheets to gain an understanding of population density.
Curated OER
How Many Animals?
Learners use their math skills to develop estimates for the population of several animal species native to the Austrailian rainforest. It is a simulation that researchers at the Center for Rainforest Studies in Australia perform to...
Curated OER
Human Population Growth
In this human population growth worksheet, students create a graph of human population growth and predict future growth using the data given in a chart. Students identify factors that affect population growth.
Cheetah Outreach
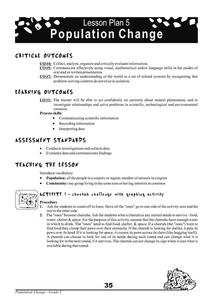
Population Change
Your youngsters become cheetahs in search of food, water, shelter, and space in a fun physical game that does a fantastic job of representing fluctuating species population based on resources available over years.


