Curated OER
All Choked Up By Smoking Statistics
Scholars use the article "More College Students Are Smoking, Study Says" as a springboard for discussion on the reasons why people smoke cigarettes. They investigate different methods of graphing statistics by using the data provided in...
Curated OER
The Correlation Between Human Population Growth and Dwindling Natural Resources
Eighth graders predict human population growth. In this lesson, 8th graders discuss the length of time needed to double the human population, work in groups to chart population growth and predict population growth in the...
Curated OER
Population Pyramids
Students create a population pyramid based on current data for their final project country. They analyze data from comprehension trends of final project country. Students analyze populations of specific countries.
Curated OER
The Fall and Rise of the White-tailed Deer Population: Conservation Success Story?
Learners analyze the problems that have come along with the conservation movement and the fall and rise of the white tailed deer population. In this conservation lesson plan, students see how important the deer were to the Native...
Curated OER
Population Biology
For this population worksheet, students will determine if 12 statements about demographic trends, including the effects of birth and death rates on populations, are true or not. Then students will match 6 population growth vocabulary...
Curated OER
Lesson 6-7: Scatter Plots and Equations of Lines
In this scatter plot worksheet, students examine tables and write a linear equation that matches the table. Students graph linear equations. They read scatter plots, determine the trend line, and write a linear equation to match...
Curated OER
How Many Is Too Many?
Learners explore the population explosion. They view a video depicting the exponential growth of human population. Students research the internet to project future population data. They perform hands-on, multimedia activities to study...
Curated OER
Population Pyramids
Students utilize population pyramids to answer questions, make comparisons, draw conclusions and support predictions about the populations of China, India and the Unites States. They arrange numbers and symbolic information from various...
Curated OER
World in the Balance
Students make estimates on how many people they believe live on Earth. While watching a video, they take notes on the issues facing Kenya, Japan and India. In groups, they calculate how long it takes for a country to double in size. To...
Curated OER
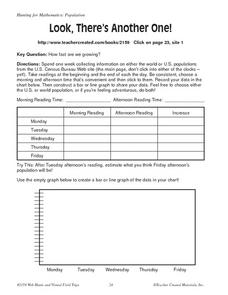
Look, There's Another One!
In this math worksheet, learners spend a week collecting information on either the word or U.S. populations from the U.S. Census Bureau Web site. Students record their data in a chart and bar graph. Learners also use the website to...
Code.org
Check Your Assumptions
Always check your assumptions when interpreting data and data visualizations. That's the take away from this exercise. Class members examine a failed project that looks at search trends to predict flu outbreaks and consider the...
Howard Hughes Medical Institute
Patterns in the Distribution of Lactase Persistence
We all drink milk as babies, so why can't we all drink it as adults? Examine the trend in lactase production on the world-wide scale as science scholars analyze and interpret data. Groups create pie charts from the data, place them on a...
Curated OER
Tracing Migration Patterns
Seventh graders analyze migration patterns. For this migration lesson, 7th graders use U.S. Census records to trace the migration patterns of 2 German families in Kansas.
Curated OER
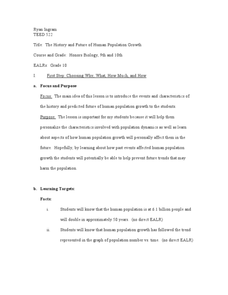
The History and Future of Human Population Growth
Young scholars create a timeline of human population growth based on guided reading. In this biology lesson, students analyze the trend of how population increased over time. They share their findings in class.
Curated OER
Lesson 3: Understanding Population Growth
Students explain population growth in Maryland and its relationship with age structure, household growth and consumption of land.
PBL Pathways
What Should Have Happened on Gilligan's Island?
"Just sit right back and you'll hear a tale ..." Gilligan's Island is a classic that spans generations and offers a problem-solving opportunity for scholars. Take a project-based learning approach to examine the population of the island....
CCSS Math Activities
Smarter Balanced Sample Items: 7th Grade Math – Target H
Not one but two box plots. How will your pupils fare? Assess their understanding of box plots by having them compare two populations. The eighth of nine installments in the Gr. 7 Claim 1 Item Slide Shows series, the resource has them...
Latin America Network Information Center
Urbanization
Brazil's population has been changing dramatically in the last century. Study the causes of Brazilian urbanization, including industrialization and and migration, and the implications for the country of the populations'...
Curated OER
Zebra Mussel Population Simulation
Students are taught how to format and enter data into an Excel spreadsheet. They make a graph, and interpret graphed data. Students discuss the possible impacts of zebra mussels on the Hudson river. They graph zebra mussel data.
LABScI
Genetic Equilibrium: Human Diversity
Investigate the Hardy-Weinberg Principle to explain genetic equilibrium. The 10th lesson plan of a series of 12 is a laboratory exploration of genetic equilibrium. Your classes use a mixture of beans to model allele and genotype...
Curated OER
Scatter Plots
In this scatter plots worksheet, students solve and complete 4 different problems. First, they use the table shown to model the relation with a scatter plot and trend line and to predict the value of a variable when given the other...
Curated OER
A Brief History of Fairfax County
Pupils brainstorm a list of things they already know about the history of Fairfax County, Virginia. After reading a primary source document, they discuss the similarities and differences between their prior knowledge and what they read....
Curated OER
Population Counts
Students role play as news teams as they investigate population information from 2001 Canadian census. They study statistical information and produce a news story.
National Council of Teachers of Mathematics
Rough Rule
For this algebra activity, learners estimate the Canadian population using the rough rule. There are two questions.


