Curated OER
Functions and Their Graphs.
Students solve equations and label it as a function or not. In this algebra lesson, students make a table of values and graph their equation. They identify the domain and range of each graph.
Curated OER
It's In The Chocolate Chips
Students investigate which brand of chocolate chip cookies contains the most chocolate. They analyze and compare data using Microsoft Word and Microsoft Excel. They communicate the results with Microsoft PowerPoint.
Curated OER
How Many?
Middle schoolers explore and design ways to collect data through simulations and random samples. They perform two experiments to determine the answers to various probability problems, and present the data/graphs in the form of a...
Curated OER
Creating Bar Graphs and Pie Graphs
Second graders observe a demonstration of the creation of a bar graph and a pie graph of their favorite colors. They gather information about various topics from their classmates, then organize the information, creating a bar and a pie...
Curated OER
Geometric Figures and Applications
High schoolers study geometric figures. They use graph paper or Geometer's Sketchpad to construct and decorate geometric shapes, and also create a 3-D polygon using construction paper and a given template.
Curated OER
Write an Equation of a Line Given Slope and a Point
Ninth graders are investigating slope of a line. The line is plotted using the slope and points on a line. They also write an equation given the right information. The use of a PowerPoint is part of the presentation.
Curated OER
Weather, Weather, Everywhere!
Sixth graders collect weather data to compare temperatures around the world. Using the Internet, learners collect data, put it into spreadsheets, and analyze and graph the results. An interesting way to cover the topic of weather.
Curated OER
The Nifty Fifty-What's Your Size?
Young scholars explore state populations. In this state geography lesson, students use a variety of technology tools to research and graph population and area of assigned states.
Curated OER
Slope
Students calculate the slope of a line. In this slope lesson, students use a graph, an equation or two points to help them calculate the slope of a line. They differentiate between a slope of zero and an undefined slope.
Bowland
Design the Mascot
Explore how resizing an object affects its area. The set of lessons challenges young mathematicians to design a mascot for electronic devices. These designs undergo resizing to determine how scale factors of dilation affect area.
Curated OER
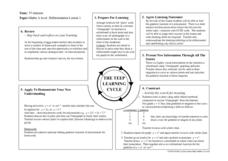
Math- A Level Differentiated Lesson
Students investigate the gradient function of a polynomial and they conduct a class discussion about its meaning. Then students use graphing software in order to examine tangents that can be seen visually to aid those who need visual...
Curated OER
Data Analysis Digital Display
Students create a survey online. In this math lesson plan, students graph survey data using flisti.com. They share and analyze their classmates' histogram.
Curated OER
Lesson 2: The Quadratic Equation
Students graph quadratic equations. They use interactive graphs, on CD-ROM, to answer specific equations. Students identify the vertex of a parabola and the axis of symmetry.
Curated OER
Bias in Statistics
Students work to develop surveys and collect data. They display the data using circle graphs, histograms, box and whisker plots, and scatter plots. Students use multimedia tools to develop a visual presentation to display their data.
Curated OER
Using Excel to Draw a Best Fit Line
Middle schoolers create line graphs for given data in Microsoft Excel. Students follow step by step instructions on how to create their graph, including how to create a trend line. Middle schoolers print graphs without trend lines and...
Curated OER
PowerPoint Probability
Sixth graders investigate film making by creating a video about probability. In this math visualization instructional activity, 6th graders create a presentation for their class demonstrating the probability of random events taking...
Curated OER
Math: a World of Symmetry
Students expand their knowledge of quadrilaterals and identify basic symmetrical forms. Over three weeks, they explore the math, application, and discussion of symmetry. After conducting Internet research, students create symmetrical...
Curated OER
Graphing Equations
Students use an interactive website or cd rom to graph equations. The lesson plan is not very clearly written. The use of the website is essential or the educational software that can be purchased from the Prentice Hall publisher.
Curated OER
Pick a Pet
Students construct a pictograph of favorite pets. In this pets and graphing activity, students discuss their favorite pet and use animal magazines to find their favorite pets and cut them out. Students create a pictograph using the...
Alabama Learning Exchange
Writing Equations for Parallel Lines
Acquaint your class with the concept of parallel lines. Learners watch a PowerPoint presentation about how to write equations of parallel lines. Their understanding of linear equations and slope is taken a step further by the...
Curated OER
Remembering Our Veterans
Eighth graders research a variety of military statistics while using the theme of Remebering Our Veterans. They use data management to plan and create a PowerPoint presentation with their findings. They incorporate different types of...
Curated OER
Teaching Polygons using Technology
Third graders utilize different types of computer programs, such as Microsoft paint and Microsoft Word to study and create different types of polygons. They use PowerPoint to create a story about a shape and others that it meets during a...
Curated OER
Osprey Journey
Students investigate the migration route of one bird, Osprey B4, using information gathered from satellites to track birds over a two-year period. They coimpare their graphs with maps of B4's migrations that have been plotted by...
Curated OER
Order of Operations
Sixth graders participate in an introductory lesson on the order of operations. In this order of operations lesson, 6th graders watch a video clip and a SMART Notebook or PowerPoint presentation of the concept. They apply a pneumonic...


