University of Wisconsin
Measuring Slope for Rain Gardens
The slope of the land is an important feature when considering the erosion that will occur. In this resource, which is part of a rain garden unit, learners calculate the slope of the proposed garden site. Even if you are not planning a...
Curated OER
Slope of a Line
For this slope of a line worksheet, students read about line graphs and plotting the slope of a line. They read about the rate of change which is represented by the slope. Students practice finding the slope of lines.
Curated OER
Graphing Speed; Slope
In this graphing speed worksheet, students find the slope in a position vs. time graph to be the speed. They are given example graphs of position vs. time to show the changes in slope reflect the changes in speed. Students match terms...
Curated OER
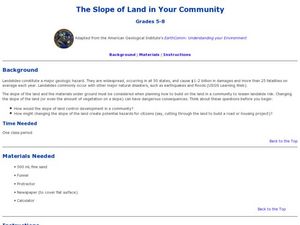
The Slope of Land in Your Community
Learners participate in finding the slope of a sand pile and then other materials. In this geology lesson, students describe what happens to the piles of materials when they are poured through a funnel. Learners measure the slope using a...
Curated OER
Rates and Slopes: An Astronomical Perspective
In this rates and slopes activity, students solve 2 problems where they find the rate corresponding to the speed of the galaxies in a Hubble diagram for galaxies and they calculate the rate of the sunspot number change between indicated...
Curated OER
Is there Treasure in Trash?
More people, more garbage! Young environmentalists graph population growth against the amount of garbage generated per year and find a linear model that best fits the data. This is an older resource that could benefit from more recent...
Curated OER
A Sweet Drink
Students investigate reaction rates. In this seventh or eighth grade mathematics lesson, students collect, record, and analyze data regarding how the temperature of water affects the dissolving time of a sugar cube. Studetns...
Curated OER
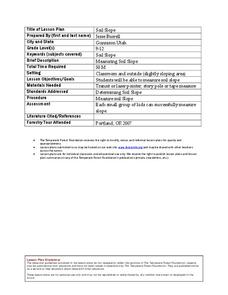
Soil Slope
High schoolers study how to measure the soil slope of an area. In this soil instructional activity students work in groups and complete an activity that allows them to find the slope of a given area.
Curated OER
Scientists Track the Rising Tide
In this tracking the rising tide worksheet, students use the data in a graph showing the seal level change versus time from 1900 to 2000 to answer 3 questions about the rising tides. Students determine the slope of a line drawn from 1920...
Curated OER
Flipping Coins: Density as a Characteristic Property
Young scholars explore linear functions in a crime solving context. They collect and analyze data using linear equations, then interpret the slope and intercepts from a linear model.
Curated OER
Keep it Bottled Up: Linear Rates of Pressure Increase
Pupils explore linear functions in this lesson when they collect and analyze data as a chemical reaction proceeds. Learners record pressure versus time data and model the data as a linear function. They also examine the concept of slope...
Kenan Fellows
Density
Most scholars associate density with floating, but how do scientists determine the exact density of an unknown liquid? The third lesson in a seven-part series challenges scholars to find the mass and volume of two unknown liquids. Each...
Texas Instruments
TI-Nspire™
We landed on the moon with less computing capabilities than you can find in this app! Here is a multiple function calculator that takes all the power you get from a handheld and adds the wonderful large screen that only a tablet can...
Curated OER
Hybrid Vehicles: Cut Pollution and Save Money
Math and science meet in this lesson on hybrid electric automobiles. This 24-page resource provides everything you need for teaching a lesson that compares the use of internal combustion engines to hybrid electric engines. Participants...
NOAA
Biological Oceanographic Investigations – Keep Away
As of 2015, there are 53,481 oil wells in the Gulf of Mexico. Scholars determine how species diversity is impacted based on the ecosystem's distance from a drilling platform. It focuses on finding the mean of data sets...
Curated OER
Earth's Rotation Changes and the Length of the Day
In this Earth's rotation and day length learning exercise, students are given a table with the period of geological time, the age of the Earth and the total days per year. Students calculate the number of hours per day in each geological...
Curated OER
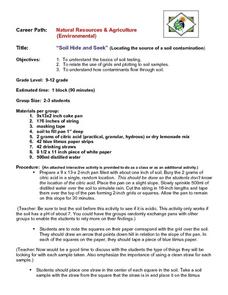
"Soil Hide and Seek"
Students comprehend the basics of soil testing. They relate the use of grids and plotting to soil samples. Students comprehend how contaminants flow through soil. They discuss factors such as: slope of the pan, time, and the amount of...
Curated OER
Volcano Activity
In this volcano worksheet, students measure the slope of a volcano and its baseline and summit degrees. They identify the type of volcano, the type of lava and the type of eruption.
Curated OER
Mathematical Analysis of Temperature Scales
Students use the point-slope formula to determine the relationship between the Celsius and Fahrenheit scales of temperature. They use a graphing calculator to determine the slope of the line between two points in each scale.
Curated OER
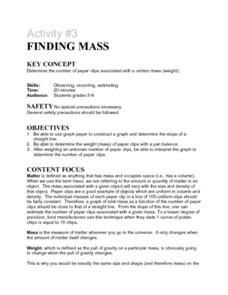
Activity #3 Finding Mass
Students use graph paper to construct a graph and determine the slope of a straight line. They determine the weight (mass) of paper clips with a pan balance. Pupils weigh an unknown number of paper clips, and to interpret the graph to...
InqueryPhysics
Interpreting Motion Graphs
Every movement in the world can be measured and even motionless objects can be significant indicators of movement. Focus on motion graphs that feature distance vs. time, speed vs. time, and positive and negative acceleration.
Columbus City Schools
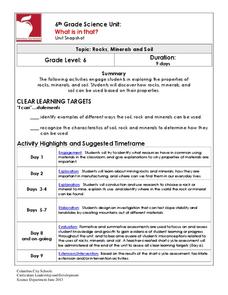
What is in that?
Invite your class to dig in to an engaging journey into the world of mining! Here you'll find the tools to equip young miners with knowledge of soil, rocks, and minerals, as well as types of mining operations. To round things out, the...
NOAA
Biological Oceanographic Investigations – What's in That Cake?
Have you ever tried to find hidden items in a picture when you don't know what you are looking for or how many things are hidden? A lesson applies that same concept to sampling the deep sea habitats. Participants must first create a...
Curated OER
Winter-time Temps
Young scholars measure temperature and become aware the the temperature above and below the snow is different. In this winter temperature lesson, students measure temperatures to find variation based on how the snow is packed....
Other popular searches
- Word Problems Finding Slope
- Finding Slope of Graph
- Finding Slope Powerpoint
- Finding the Slope of a Line
- Finding Slope for Surveying
- Finding Slope Secant Line
- Finding Slope From Two Points
- Finding Slope of a Line
- Finding Slope Graphically
- Finding Slope Fromg Raphs
- Finding Slope From a Graph
- Prealgebra Finding the Slope


