Curated OER
Going Graph-y
Second graders listen to and dicuss the story Where the Wild Things Are. They play a pantomime game and act out various feelings so their classmates can guess. They listen for the frequency of certain words, and record their findings on...
Curated OER
Weather Watchers
Students identify basic weather instruments and how they are used to record weather data. Students define several vocabulary terms as stated in lesson. Students use basic instruments to record weather data in their area. Students use the...
Curated OER
Bubbles Galore
Students investigate bubbles. In this science lesson, students observe how long bubbles last and graph the results of the experiment.
Virginia Department of Education
Linear Curve of Best Fit
Is foot length to forearm length a linear association? The class collects data of fellow scholars' foot length and the length of their forearms. They plot the data and find a line of best fit. Using that line, they make predictions of...
Curated OER
Line of Best Fit
For this line of best fit worksheet, students solve and complete 8 different problems that include plotting and creating their own lines of best fit on a graph. First, they study the samples at the top and plot the ordered pairs given on...
Radford University
Modeling Statistical Data
Can people predict the number of future divorces? Scholars research and analyze data on the number of divorces and teenage pregnancies in Virginia over time. They use the data to create graphs, determine the best-fit equations, and make...
Radford University
Snappy Stair Sprints
Let's go for a run. Small groups determine a way to collect data to determine the time it would take to run a set of stairs. After creating a plan, teams collect data and graph their results, calculating the equation of best fit and...
EngageNY
Modeling with Polynomials—An Introduction (part 2)
Linear, quadratic, and now cubic functions can model real-life patterns. High schoolers create cubic regression equations to model different scenarios. They then use the regression equations to make predictions.
101 Questions
Coins in a Circle
Round and round you'll go! Learners watch as different-sized circles fill with coins. They collect data and then make a prediction about the number of coins that will fit in a large circular rug.
Purdue University
The Case of the Pilfered Pin: A Measurement Inquiry Activity
Who pilfered the pin? Scholars practice measurement skills as they solve the mystery of a stolen pin. They measure length, temperature, and mass and determine which of select suspects committed the crime. During the STEM hands-on...
Under the Dome
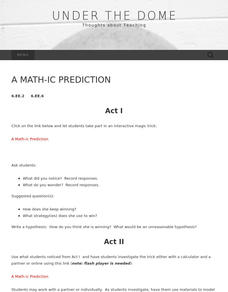
A Math-ic Prediction
Trick out mathematical expressions. Scholars participate in a computerized magic trick where the computer guesses the final answer to a series of operations. Pupils investigate the trick to determine what is happening. Individuals then...
Curated OER
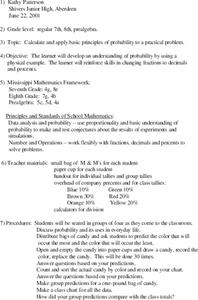
Probability using M & M's
Using M & M's candies, young statisticians predict the color distribution in a packet of candies and test their predictions against their group and the larger class. A review of converting between fractions, decimals, and percents...
Curated OER
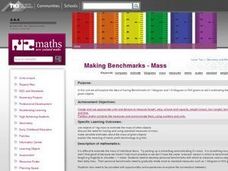
Making Benchmarks - Mass
Elementary schoolers predict the mass for different objects. Then, using objects of 1kg mass, they make a more precise prediction. Afterwards, they discuss the need for having and using standard measures of mass.
Kenan Fellows
Lego Thinking and Building
Run a simulated airplane manufacturing plant with your pupils as the builders! Learners build Lego airplane models and collect data on the rate of production, comparing the number produced to the number defective. Using linear...
Curated OER
Little Boy Blue
First graders read nursery rhymes and celebrate Mother Goose. In this drawing conclusions and predicting lesson, 1st graders create new ending for the nursery rhymes. Students gather data and make a graph showing their favorite rhyme.
Radford University
Tuition Cost Activity
Can I afford to go to college? Small groups design a method to research college tuition for several years and make a prediction of costs in 2025. Classmates plot the the data on a scatter plot and graph the line of best fit to make their...
Radford University
Is it Really a Small World After All?
Working in groups, learners research four countries' populations over the past 30 years. Using the data collected, the teams find regression equations that best fit the data. Taking the regression equations, they then make predictions...
Curated OER
Foliage Tracker
Young scholars discuss the change of leaf colors and the role that climate and elevation play in those changes. They then track leaf changes, input data, and graph foliage changes with a free online tool.
Curated OER
Measuring Area: Sensible Flats
Here's how to calculate the areas of polygonal figures. In this measuring area lesson, upper graders use hash marks to create and count square units. They also problem solve a cyberchase activity watching Quicktime videos.
Curated OER
Barbie Bungee
Middle and high schoolers collect and analyze their data. In this statistics lesson, pupils analyze graphs for linear regression as they discuss the relationship of the function to the number of rubber bands and the distance of the...
Curated OER
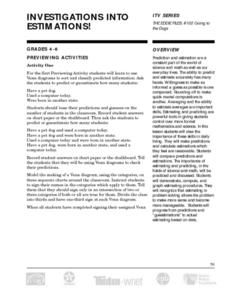
Investigations into Estimations
Students gain the powerful tools of estimation, prediction, and averaging and discover the importance these tools have in daily living.
Curated OER
Jellybean Graphs
Second graders predict and graph data based on the color of jelly beans they think are in a handful. In this prediction lesson plan, 2nd graders will predict how many of each color jellybean are in a handful. Then they graph these...
Curated OER
Magnets and Interactions
Second graders discover what magnets can do. In this magnet instructional activity students make predictions about magnets. They experiment with the magnets and record their data on a chart.
Curated OER
Fall Leaves Fall! Lesson Plan
Students discover facts about leaves. In this early childhood lesson plan, students identify different types of leaves, and make predictions about which types of leaves they think they will find in their community. Students collect...
Other popular searches
- Reading Making Predictions
- Pictures Story Predictions
- Lesson on Making Predictions
- Reading Predictions
- Literary Predictions
- Predictions in Reading
- Predictions and Probability
- Making Predictions Worksheet
- Story Predictions
- Inferring Meaning Prediction
- Hurricane Prediction
- Prediction Science


