College Board
2010 AP® Environmental Science Free-Response Questions
Scientists rely heavily on data to make predictions and find solutions. Young scholars become scientists as they analyze information presented to them to construct responses. They consider scenarios related to air pollution, invasive...
Achieve
Ivy Smith Grows Up
Babies grow at an incredible rate! Demonstrate how to model growth using a linear function. Learners build the function from two data points, and then use the function to make predictions.
California Education Partners
Science Fair Project
Plant the data firmly on the graph. Given information about the growth rate of plants, pupils determine the heights at specific times and graph the data. Using the information, scholars determine whether a statement is true and support...
Science Matters
Formative Assessment #2
Learners work collaboratively to predict what life would be like as an Arctic Hare. Teams go on a hunt where scholars role play an owl, white hares, and gray hares. Independently, pupils record their findings and reflect on their...
Achieve
Spread of Disease
Viruses can spread like wildfire, and mathematics can model the speed of infection. Given a function, scholars analyze it to describe the spread of a disease within a stadium. Learners find the initial number infected and the maximum...
Curated OER
2007 U.S. National Chemistry Olympiad Part II
Eight multi-step chemistry problems, including analyzing a titration, writing equations, predicting products and limiting reagents, calculating concentrations of ions, and using stoichiometry to solve for unknowns in reactions make up...
Concord Consortium
Gestation and Longevity
Is the gestation length of an animal a predictor of the average life expectancy of that animal? Learners analyze similar data for more than 50 different animals. They choose a data display and draw conclusions from their graphs.
Chicago Botanic Garden
Unit 4 Pre-Assessment
Pre-assessments are great to help teachers determine what information their classes lack, what misconceptions they have, and how in depth to teach specific concepts. The first in a five-part series is a pre-assessment of middle...
Science Matters
Spaghetti Fault Model
Does increasing the pressure between two moving plates provide a stabilizing force or create more destruction? The hands-on instructional activity encourages exploration of strike-split fault models. The sixth instructional activity...
Chicago Botanic Garden
Review and Assessment: Causes and Effects of Climate Changes
The last activity in the series of five is a short one where individuals show what they've learned about the causes and effects of climate change. Working independently, they fill in a graphic organizer, then compare their notes with a...
Noyce Foundation
Ducklings
The class gets their mean and median all in a row with an assessment task that uses a population of ducklings to work with data displays and measures of central tendency. Pupils create a frequency chart and calculate the mean and median....
Achieve
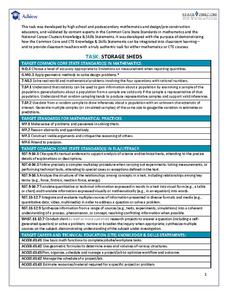
Task: Storage Sheds
Bridge the gap between mathematics and Career Technical Education. Pupils research the cost associated with building storage sheds and analyze possible profit. They build scale models and determine if building and selling the sheds is a...
Curated OER
Basketball Bounces, Assessment Variation 2
This un-scaffold summative assessment tasks learners to use the height of a bouncing basketball, given the data in graph and table form, to choose the model that is represented. Learners then use the model to answer questions about...
Utah Education Network
Uen: Gravity: Head for the Hills
Using this interactive resource will involve making predictions about the effects of gravity in different conditions.


