Hi, what do you want to do?
Curated OER
Summer Science Lesson Plans
You can use these lesson plans to incorporate some science into your summer.
Curated OER
"Mr. Betts and Mr. Potts"
First graders listen to the book "Mr. Betts and Mr. Potts" and examine the career of being a veterinarian. They categorize animals based on whether they could be house pets or not, develop a class pet graph, and list the various...
Curated OER
Physical Science: Festival of Bubbles
Investigate bubbles through the use of scientific inquiry. Pupils blow bubbles using several methods and measure the resulting bubble print. Measurements are recorded on a data table and transferred to a bar graph. Results are discussed...
Curated OER
A Fortnight of Furlongs
Young scholars perform a webquest to research information about the horse industry. They look at economic and the cultural impact of the industry on Central Kentucky and then create a group presentation that addresses all essential...
Curated OER
Bats: Fact and Fiction
Students describe the characteristics and behaviors of bats. After viewing a video, they explain how bats use echolocation to navigate and how they find their young within a group. They list four misconceptions about the animal and...
Curated OER
Inside Out: An Up-Close Look At Foods We Eat
Fourth graders identify the origins of meats and vegetables consumed by humans on a daily basis. They classify foods (meats, dairy products, grains...) and create a food pyramid.
Curated OER
A Thanksgiving Survey
Students take a survey then use the information gained from the survey to help plan a typical Thanksgiving dinner for our last day of class. They create a graph which corresponds the the data gathered during interviews.
Curated OER
What To Do After The Hands-Are-On
Young scholars perform various demonstrations for each of Newton's Laws, collect data, and write a conclusion for each.
Curated OER
How Large is a Mole of M&M's
Students calculate whether or not a mole of M&M's fill their high school. They practice factor-labeling, define a mole, and calculate the number of cubic feet per mole of M&M's. To answer the question they measure and calculate...
Curated OER
Is Global Warming Happening?
Students investigate the probability of global warming and the effects of global warming on the environment. They conduct Internet research and collect data, transfer the data onto an Excel spreadsheet, and create a presentation that...
Curated OER
Shadow Chasing
First graders observe and measure their shadows. They go outside at three hour increments during the course of a day. Each time students measure and record the length of their shadows. Students read books about shadows and discuss why...
Curated OER
Egyptians as Engineers
Student design and build Lego vehicles that drag given amount of weight up an incline. They show how this demonstrates Egyptian methods of pyramid construction.
Curated OER
Introduction to the e-Mission Operation Montserrat
Students read and discuss short articles which "brief" them on the coming mission. After they read each of the articles, they discuss the main ideas and the requirements for mission training. This is an introductory lesson to a...
Curated OER
Uncle Bubba Is Dead!
Students spend imaginary inheritance of $100,000 on a home and furnishings.
Curated OER
Blindfolded Building
Learners build a Lego design and then work with a partner to reproduce that design. They guide the building of the reproduction by description only and then check their work.
National Council of Teachers of Mathematics
The Math Forum: Exploring Ocean Data Lesson Plan
Find "oceans of data" for students of all ages. NCTM, California, and Philadelphia standards are listed for each grade level along with lesson plans and other website resources.
PBS
Nova Online: How Many Pearls? A Weight & Volume Game
This interactive game has students apply skills in estimation, measurement, and basic addition using pearls. Students are asked to estimate the number of pearls in a treasure chest by making predictions and using number sense. The skills...
Alabama Learning Exchange
Alex: Can You Curl Your Tongue?
This lesson is adapted from a Connected Mathematics Unit, How Likely is It? This investigation introduces biology as a source of applications for probability. For this lesson, Curling your Tongue, students determine how many students in...
University of Cambridge
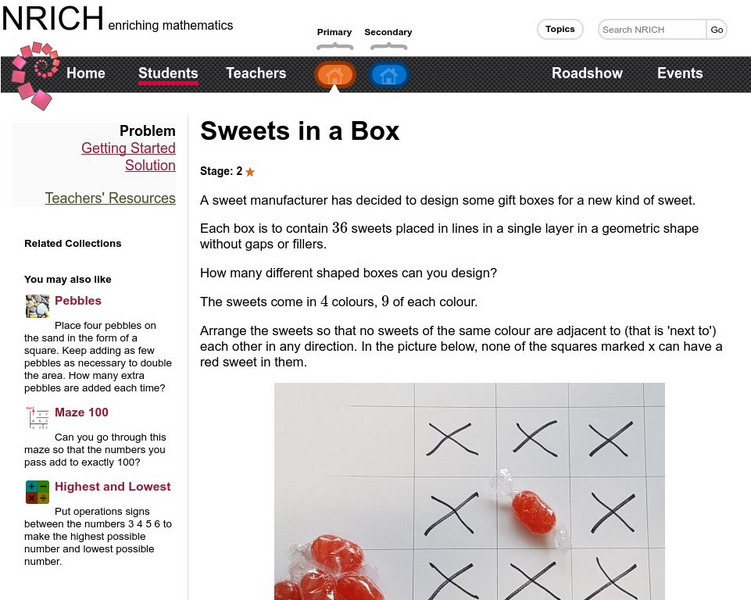
University of Cambridge: Nrich: Sweets in a Box
Improve logic and pattern creation skills performing this game. Includes solution.
National Council of Teachers of Mathematics
Nctm: Figure This: How Many Fish in the Pond?
Can you figure out how many fish are in a pond? Use the statistical method of capture-recapture and estimation to solve this math challenge. An investigation from the NCTM Math Challenges for Families series. Discover how this skill can...
University of Cambridge
University of Cambridge: Nrich: Bike Ride
On this one page website sharpen your logic and rate measurement skills while working on this challenge. The solution is available to double check your solution.
National Council of Teachers of Mathematics
Nctm: Figure This: Beanie Babies, Profit or Loss
Is you Beanie Baby business booming or busted! Figure out if you made a profit or lost money in this mathematic computation activity. A one page activity from the NCTM Math Challenges for Families collection that focuses on adding and...
University of Cambridge
University of Cambridge: Nrich: How Old?
On this one page website sharpen your logic and pattern recognition skills while working on this challenge. The solution is available to double check your solution.


