Florida International University
Counting FishStix
How do we count the fish in the ocean? An engaging lesson models how to estimate fish populations with observational surveys. Class members begin by studying the behavior of fish on the coral reef in the oceans. They then become the fish...
Virginia Department of Education
Weather Patterns and Seasonal Changes
Get your class outside to observe their surroundings with a lesson highlighting weather patterns and seasonal changes. First, learners take a weather walk to survey how the weather affects animals, people, plants, and trees during...
Intel
Play Ball!
Math and sports meet on the baseball diamond in the first STEM lesson in a series of six that asks pupils to collect and perform comparative analyses of data specific to baseball. Following the analysis, scholars create a presentation...
It's About Time
Factors Affecting Population Size
How do we predict future population growth? Young researchers investigate various factors affecting the size of our population. As they calculate and interpret graphs to determine factors that could potentially affect increases and...
Bowland
Mystery Tours – Plan Your Tour
Everyone loves a vacation and a set of three activities has groups planning a tour of the U.K. using given distance, time, and price data. They solve a variety of problems related to the trip and produce a report on the success of the trip.
University of Richmond
Canals 1820-1860
While canals are not a common mode of transportation today, they were part of the fuel for America's industrialization. However, most of them were located in the North, also feeding regional differences and sectionalism. Using an...
NOAA
How Do We Know?: Make Additional Weather Sensors; Set Up a Home Weather Station
Viewers learn about three different weather measurement tools in installment five of the 10-part Discover Your Changing World series. They build weather vanes to collect data on wind speed, barometers to determine air pressure, and rain...
CCSS Math Activities
Smarter Balanced Sample Items: 6th Grade Math – Target J
What is the best measure of central tendency? Scholars explore mean, median, mode, range, and interquartile range to understand the similarities and differences. They display data in dot plots, histograms, box plots, and more as part of...
University of Richmond
Foreign-Born Population 1850-2010
If America is a nation of immigrants, where are they from and why did they come? Demographic data and interactive maps help pupils consider answers to these questions by examining the statistics of foreign-born Americans. Features allow...
Flipped Math
Correlation
Determine how close the line is to the scatter plot. Clear video instruction shows how to plot a scatter plot and find the best fit line using the linear regression function on a calculator. Pupils use the information from the calculator...
Curated OER
The Demographics of Immigration: Using United States Census Data
Learners work together to analyze United States Census data on immigration. They compare and contrast the data and determine how immigration numbers have changed over time. They calculate percentages and make their own conclusions...
Curated OER
Analysis of Data
Students analyze DNA banding patterns for similarities and differences among individuals and between populations. They examine individual prepared gels then pool the class data to come to an overall conclusion.
Curated OER
Dealing with Data
Seventh graders collect and analyze data. In the seventh grade data analysis lesson, 7th graders explore and/or create frequency tables, multiple bar graphs, circle graphs, pictographs, histograms, line plots, stem and leaf plots, and...
Curated OER
Data Analysis and Measurement: Ahead, Above the Clouds
Students explore and discuss hurricanes, and examine how meteorologists, weather officers, and NASA researchers use measurement and data analysis to predict severe weather. They plot points on coordinate map, classify hurricanes...
Curated OER
Data Management and Probability: Applications
In this data management and probability applications instructional activity, 7th graders solve 13 different types of problems that include finding the mean, median, mode, and range of each set of values, as well as, solving a number of...
Curated OER
First Class First? Using Data to Explore the Tragedy of the Titanic
Learners analyze and interpret data related to the crew and passengers of the Titanic. They research information on a Titanic database to illustrate specific statistical conclusions, and whether or not social status affected the outcome.
Curated OER
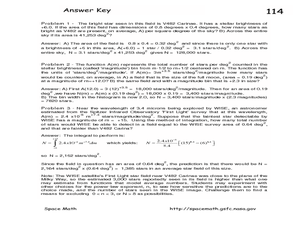
Exploring Power-Law Functions Using WISE Data!
For this power-law functions worksheet, students solve 3 problems using data from the Wide-field Infrared Survey Experiment in the constellation Carina. Students use a photograph to determine the number of stars as bright as the...
Curated OER
Graphing Information from a Data Table
For this graphing worksheet, students solve 12 problems in which data on a table is presented on a bar graph. This page is intended to be an online activity, but may be completed with paper and pencil.
Curated OER
Data Analysis
Students examine techniques to represent data. In this data analysis lesson, students read about various ways to represent data, such as a stem and leaf diagram and calculating standard deviation. Students complete data analysis...
Curated OER
Looking at Data
Third graders use two days to create, collect, display and analyze data. Classroom activities and practice build greater understanding to a variety of forms used to display data.
Curated OER
Inside OKCupid: The Math of Online Dating
Capture the hearts of your young statisticians with this real-life example of using statistics in online dating. The use of average and geometric mean are discussed in the context of creating the algorithm used to connect people.
Laboratory for Atmospheric and Space Physics
Science at 100,000 Feet
Take your class up, up, and away with an engaging weather balloon simulation! Individuals get hands-on experience in creating and launching their own airborne labs to study how temperature and pressure affect substances at 100,000 feet.
Curated OER
Data Handling: Pictogram of Birds
In this pictograph problem solving worksheet, students analyze a pictograph of birds seen each day for a week. They use the information on the graph to solve 6 problems.
EngageNY
Analyzing Graphs—Water Usage During a Typical Day at School
Connect your pupils to the problem by presenting a situation with which they can identify. Individuals analyze a graph of water use at a school by reasoning and making conclusions about the day. The instructional activity...


