Curated OER
Shake It Up with Scatterplots
Students identify how to use a scatterplot to compare two sets of data to determine if they are related. Then they identify and describe the definition of regression line (the "line of best fit"). Students also identify how scientists...
Curated OER
Heads or Tails?
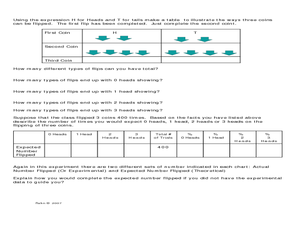
In this probability learning exercise, 1st graders toss a penny in the air 5 times and fill in a chart on how many times it landed heads up and/or tails up. Students complete this activity three times.
Noyce Foundation
Ducklings
The class gets their mean and median all in a row with an assessment task that uses a population of ducklings to work with data displays and measures of central tendency. Pupils create a frequency chart and calculate the mean and median....
Beyond Benign
Can You Hear Me Now? Cell Phone Accounts
How sustainable are cell phones? Throughout the unit, learners explore the issues around cell phones concerning sustainability. Class members take a graphical look at the number of cell phones across the world using a box-and-whisker...
Curated OER
Data Analysis, Probability, and Discrete Mathematics
Fourth graders analyze the data in a bar graph, pictograph, line graph, and a chart/table and draw conclusions based on the data. They discuss each type of graph, write questions for each graph, and analyze the data as a class.
Curated OER
M&M Graphing and Probability
Students create a variety of graphs. They count, sort, and classify M&M's by color and record data on a chart. They use data from the chart to create pictographs, bar graphs and circle graphs. They analyze data and determine...
Curated OER
Probability
Sixth graders explore probability. They analyze a class chart and list the letters of the alphabet according to frequency. Using the data collected, they complete probability problems.
Curated OER
Exploring Probability
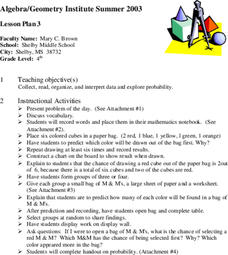
Fourth graders participate in a lesson that explores probability. They use candy and model cubes to experiment with different outcomes that can be charted if the students can proceed to the objective of the lesson. They discover how...
Curated OER
Probability
Eighth graders relate real life events with probability. In this probability instructional activity, 8th graders investigate using coin toss, discuss NBA shooting percentages and MLB batting averages. Students also complete a worksheet.
Curated OER
M&M Graphing
Youngsters sort M & M's by color. They graph the M&M's by color on a graph. This classic lesson is a wonderful way to introduce the concept and technique of graphing to young mathematicians. Pairs of kids can make up their own...
Curated OER
Drive the Data Derby
Three days of race car design and driving through the classroom while guessing probability could be a third graders dream. Learn to record car speed, distances traveled, and statistics by using calculation ranges using the mean, median,...
Mathed Up!
Frequency Polygons
Frequency polygons are a different way to represent frequencies over intervals. Pupils take frequencies for intervals of data from a frequency table and plot them as a frequency polygon. Budding mathematicians find information about the...
Curated OER
Run, Gingerbread Men, Run!—Game
Run, gingerbread men! During the board game, four gingerbread men race to discover which one finishes first. Scholars take note of the game's results using a tally chart and bar graph for all to observe the frequency of the winning...
US Department of Agriculture
Sink or Float?
Will it sink or will it float? Learners predict the outcome as they drop random objects into a container of water. Then, they keep track of the results and record the data in a t-chart to draw a final conclusion.
Curated OER
Boxing Up
Middle schoolers explore the relationship between theoretical and experimental probabilities. They use a box model to enter data provided and to randomly draw tickets from the box. Pupils click on any bar in a chart to display the...
Curated OER
Let's Flip a Coin
In this probability worksheet, students use a TI graphing calculator to simulate flipping a coin and compare their results (experimental probability) to the expected results (theoretical probability). The five page worksheet contains...
Curated OER
Location, Location, Location!
Students determine the probability of drawing coins from each of the three United States Mints. They measure the distance between the Mints and determine which is closest to them. They convert fractions to percentages.
Curated OER
What are the Chances: A Game of Chance!
Sixth graders experiment with dice, playing cards, pennies and computer-generated simulations to calculate probability. They use compiled data to make predictions.
Curated OER
What's the Chance?
Young scholars study probability and statistics by conducting an experiment, recording their results, and sharing data with classmates.
Curated OER
Chart problems involving car defects and customer service departments
In this interactive activity, learners solve two problems using the charts provided. Students must convey they are able to understand charts and how to read them.
Curated OER
M & M Candy: I Want Green
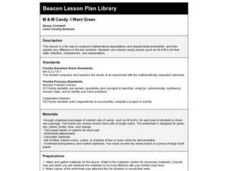
Eighth graders use colored candy pieces (such as M & M's) to compare mathematical expectations and experimental probability. They pick pieces of candy randomly, and graph their results. This classic lesson never fails to engage...
Curated OER
EMS Lesson 2: Outrageous Offspring
Young scholars investigate the principles of probability that can be used to predict hereditary traits.
Curated OER
Investigation-What are My Chances?
Second graders explore probability. In this math lesson plan, 2nd graders discuss the possibility of choosing a certain colored tile from a bag. Students perform experiments and describe the outcomes as certain, possible, unlikely and...
Curated OER
Probability or Ability?
Students fill in a probability chart while attempting to catch candy with their non-dominant hands. They replicate the activity with a coin.


