Curated OER
Z-Scores related to Psychology
In this z-score learning exercise, students identify the z-scores and percentiles corresponding to thirteen values. Students are also asked to find two probabilities. Worked solutions are provided after each question.
Houghton Mifflin Harcourt
Unit 6 Math Vocabulary Cards (Grade 6)
Fifty-eight flashcards make up a set designed to reinforce math vocabulary. Within the set, you'll find bold-faced word cards as well as definition cards that offer a labeled example. Terms include base, percent, theoretical probability,...
Alabama Learning Exchange
Probability with Tree Diagrams
Middle school math whizzes view a PowerPoint tutorial on tree diagrams. Using "Anthonio's Pizza Palace," an interactive activity involving the selection of pizza toppings, they use Pascal's triangle as a tree diagram. This is an engaging...
MEP: Demonstration Project
Unit 5 Probability Activities
Wow! Here is a 14-page package of activities to use when your math class is studying probability. There are a myriad of pertinent experiments for learners to try, such as rolling a self-constructed multi-faced three-dimensional...
Curated OER
Data Analysis and Probability
Students make their own puzzle grid that illustrates the number of sit-ups students in a gym class did in one minute, then they make a histogram for this same data. Then they title their graph and label the scales and axes and graph the...
Curated OER
Exploring Scale
Sixth graders discuss how the scale and type of graph can change how the data appears. With a partner, they identify all the information about the graph in a specific amount of time and record them in a journal. To end the lesson, they...
Glynn County School System
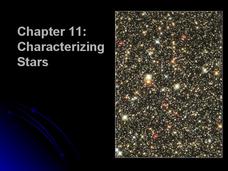
Characterizing Stars
Are brighter stars actually brighter? Turns out they are probably just closer! A presentation compares features of stars to our favorite star, the sun. In addition, solar lovers learn to classify stars based on their masses,...
Wake Forest University
Authentic Activities for Connecting Mathematics to the Real World
Check out the handout from a presentation that contains a collection of high school algebra projects connecting a variety of mathematics to the real world. Activities range from simple probabilities to calculus. The activities can be...
Curated OER
Normal Curve Areas
In this normal curve areas worksheet, students follow 6 steps to compute probability regarding possible sample means using a large sample. First, they label the scale with the mean and corresponding standard deviations. Then, students...
Curated OER
Normal Curve Areas - Population
In this normal curve areas worksheet, students follow 6 steps to compute the probability regarding the values from the population. First, they label x-scale with the mean and corresponding standard deviations and shade the area(s) under...
Curated OER
Normal Curve Areas
In this normal curve areas worksheet, students follow 6 steps to compute the probability regarding the possible sample of proportions using a large sample population. First, they label the Ps-scale with the proportion and corresponding...
Curated OER
What's Math Got To Do With It?
Students explore numbers, computation, ratios, proportions, probabilities, statistics, and money in this six lessons unit. Practical applications in the real world are emphasized through an interactive approach to math in these lessons.
Curated OER
Tree Diagrams
In this tree diagrams instructional activity, students solve and complete 10 different problems that include creating tree diagrams. First, they toss a coin and roll a die simultaneously to determine the outcomes with a tree diagram....
Curated OER
How Was Coal Formed?
Geology can be a lot of fun. Learners review geology related vocabulary, make flashcards, use encyclopedias to answer questions, then explore the formation of coal. They identify dates and order them into key time frames of geologic...
Curated OER
Scale Me Down
Young scholars create scale drawings, and ultimately scale models, of real-world objects in this Math instructional activity about ratios, proportion, scaling factors, and cross products. The instructional activity includes ideas for...
Curated OER
Probability
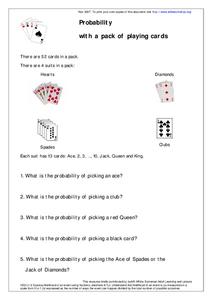
In this mathematical probability learning exercise, students utilize a deck of cards to problem solve five questions associated with a deck of cards and probability.
University of Colorado
Planetary Distances on the Playground
Earth is 149,600,000 km, or 92,957,130.4 miles, from the sun. Young astronauts create an interactive model to learn the distances between planets. Nine groups, each representing a different planet, are spread around at class-calculated...
Curated OER
Kelvin Temperatures and Very Cold Things!
For this Kelvin temperature scale worksheet, students solve 6 problems using the equations for the conversion of Centigrade to Fahrenheit and Kelvin to Centigrade. They convert between Fahrenheit and Kelvins and Centigrade and Kelvins.
Curated OER
The Risks of Everyday Living
Students compare their perceptions of risk to the perceptions of scientists and risk professionals. in small groups, they evaluate risks on a scale of 1 to 10 for the average American on a yearly basis.
Virginia Department of Education
Mathematics Vocabulary Cards – Grade 4
An excellent way to reinforce math vocabulary in your classroom! Seventy-eight posters focus on number and number sense, computation and estimation, measurement, geometry, probability and statistics, and patterns, functions, and algebra.
Howard Hughes Medical Institute
Human Impacts on Biodiversity
Have you always wanted to take your science class on an amazing field trip they will never forget? Now you can! Observe the wildlife in an African savanna through trail cameras with a five-part data analysis activity. Learners analyze...
Curated OER
Organizing Data
In this organizing data worksheet, 7th graders solve seven different types of problems related to data. They first identify the type of data as categorical, discrete or continuous from the information given. Then, students use Excel to...
Virginia Department of Education
Mathematics Vocabulary Cards - Grade 2
Augment your math curriculum with posters detailing several concepts important to second grade math. Each poster features one math term from geometry, measurement, probability and statistics, computation and estimation, numbers and...
It's About Time
The Doppler Effect
In 1842, Christian Doppler proposed a theory relating the change of wavelengths based on motion. Young scholars observe the Doppler Effect on a small scale in a ball, on a larger scale from a car, and on the largest scale studying the...


