EngageNY
Distance on the Coordinate Plane
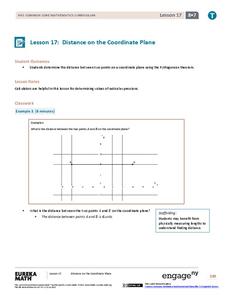
Apply the Pythagorean Theorem to coordinate geometry. Learners find the distance between two points on a coordinate plane by using the Pythagorean Theorem. The vertical and horizontal change creates a right triangle, which allows...
Curated OER
A Model Solar System
If Earth is modeled by a grapefruit, what planet could be represented by a golf ball? This activity uses everyday and not-so-everyday objects to create a model of the Solar System.
101 Questions
Bean Counting
Don't spill the beans ... before the end of the lesson! Learners must predict how long it takes two people working together to fill a glass with beans. A video presents the rate it takes each person independently, and another video...
Carstens Studios
Math Doodles
Discover the joy and excitement of improving your math fluency through four different puzzles. Combine those with 25 different ways to represent numbers and you have hours of enjoyment that can be fun outside of the classroom as well.
EngageNY
Margin of Error When Estimating a Population Mean (part 1)
We know that sample data varies — it's time to quantify that variability! After calculating a sample mean, pupils calculate the margin of error. They repeat the process with a greater number of sample means and compare the results.
Curated OER
Spirals
In this secondary mathematics worksheet, students determine if the two given spiral drawings are alike or different. The one page worksheet contains one problem with the solution.
EngageNY
Distributions and Their Shapes
What can we find out about the data from the way it is shaped? Looking at displays that are familiar from previous grades, the class forms meaningful conjectures based upon the context of the data. The introductory lesson to descriptive...
Math Worksheets Land
Percent Error and Percent Increase - Step-by-Step Lesson
Half a foot difference may not mean much, but converting that to an 8% change puts it into perspective for young minds. The lesson discusses the idea of converting information into percents to discover errors made and how much it...
Illustrative Mathematics
Running Time
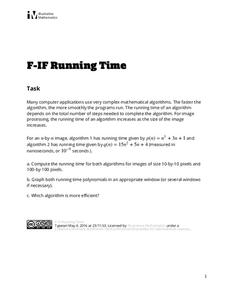
Ever wonder why that computer image takes so long to load? Well, math is involved and provides the algorithms needed to compute the measure in nanoseconds. Young mathematicians plug the image measures into the formulas and compare the...
EngageNY
Equations for Lines Using Normal Segments
Describing a line using an algebraic equation is an essential skill in mathematics. The previous activity in the series challenged learners to determine if segments are perpendicular with a formula. Now they use the formula to determine...
EngageNY
Events and Venn Diagrams
Time for statistics and learning to overlap! Learners examine Venn Diagrams as a means to organize data. They then use the diagrams to calculate simple and compound probabilities.
EngageNY
Using Sample Data to Estimate a Population Characteristic
How many of the pupils at your school think selling soda would be a good idea? Show learners how to develop a study to answer questions like these! The lesson explores the meaning of a population versus a sample and how to interpret the...
Illustrative Mathematics
Jamir's Penny Jar
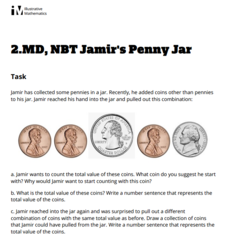
Before you start counting the coins in Jamir's coin jar, figure out which coin to start with. Should it be the penny or the quarter? Why? This is the focus around a worksheet that works well as an assessment on counting money and...
Flipped Math
Modeling with Trig Functions
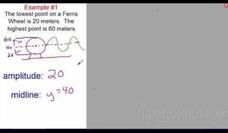
Find out what to do with Ferris wheels that keep going up and down. Individuals learn how to determine the frequency of a trigonometric function. Pupils use their knowledge of trigonometric functions to model periodic motions like Ferris...
Saxon
Plotting Functions
Youngsters use a graphing calculator to assist in creating a function table. They graph the function on a coordinate plane. They explore the relationship between the domain and range in the graph. This four-page worksheet contains two...
West Contra Costa Unified School District
Solving Radical Equations
How can you make solving radical equations more engaging? Provide your math class with a hands-on activity that focuses on solving radical equations with flash cards. A warm-up and exit ticket flank direct instruction of the steps...
EngageNY
Estimating Probabilities by Collecting Data
Take a spin to determine experimental probability. Small groups spin a spinner and keep track of the sums of the spins and calculate the resulting probabilities. Pupils use simulated frequencies to practice finding other probabilities to...
EngageNY
Chance Experiments with Outcomes That Are Not Equally Likely
The fifth portion of the 25-part series introduces probabilities calculated from outcomes that are not equally likely. Class members use tables to calculate probabilities of events, add outcome's probabilities, and find complements....
Illustrative Mathematics
Fraction Equivalence
Why is six-tenths equivalent to sixty-hundredths? This is the question learners are tasked to explain in writing as well as with a picture.
101 Questions
Pedestrian Countdown
You won't find yourself racing the clock on such a great task. Scholars use video information to predict the time left on a crosswalk signal after a pedestrian crosses. The video shows the time left on the counter, and individuals must...
101 Questions
Joulies
Does your coffee get too cold too fast? Joulies just might be your answer! Learners use experimental data to make a conclusion about how effective Joulies are at keeping coffee at the ideal temperature. A video shows the graph of the...
Concord Consortium
Bill the Ball Bearing Man
Just how durable could a hollow ball bearing be? Learners model the strength of the walls of a ball bearing as a function of the radius of its cavity. They use their models to make reasonable conclusions about the probability of failure...
Concord Consortium
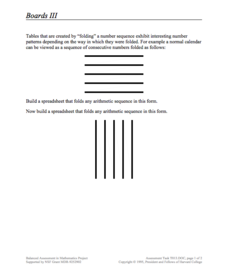
Boards III
Learn to visualize mathematical patterns as a folded pattern. Beginning with a visual display, the task encourages pupils to view sequences as a folded table. The pattern of the table then becomes a formula in a spreadsheet that...
Concord Consortium
School Bus Routes
Plan the way to school. Given a map of a school district, class members portray a transportation consultant hired to develop a bus transportation plan that will pick up the eligible riders and get them to school. The plan must contain...
Other popular searches
- Problem and Solution Stories
- Problem Solution Passages
- Problem and Solution Reading
- Problem Solution Essay
- Problem Solution Reading
- Assess Problem and Solution
- Problem Solution Writing
- Problem and Solution Writing
- Problem Solution Essay Test
- Problem and Solution Essays
- Problem and Solution Passages
- Problem Solution La


