Mathematics Assessment Project
Journey
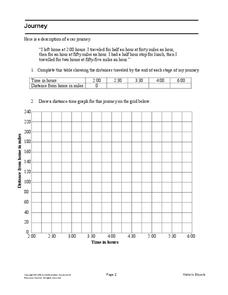
Drive home math concepts with an engaging task. Learners follow a verbal description to fill in a table and create a distance-time graph representing a car journey. They then answer questions by interpreting the graph.
CCSS Math Activities
Smarter Balanced Sample Items: 8th Grade Math – Target F
Functions model relationships between quantities. The Smarter Balanced sample items demonstrate the assessment strategies for eighth grade function modeling standards. Items range from constructing linear functions from a table and a...
Curated OER
More graphing situations by making a table
Students make a table and graph plotting points. In this algebra lesson, students graph linear equations on a coordinate plane. They calculate the rate of change and analyze the graph for extrapolation.
EngageNY
Comparing Linear Functions and Graphs
How can you compare linear functions? The seventh installment of a 12-part module teaches learners how to compare linear functions whose representations are given in different ways. They use real-world functions and interpret features in...
Charleston School District
Pre-Test Unit 3: Functions
How does an input affect an output? Assess your learners' ability to answer this question using this pre-test. Scholars answer questions about the basics of a function. Topics include determining if a table or statement represents a...
EngageNY
Linear Functions and Proportionality
Connect linear equations, proportionality, and constant rates of change to linear functions. Young mathematicians learn how linear equations of the form y = mx + b can represent linear functions. They then explore examples of linear...
Wordpress
I Can Find Slope
Your young mathematicians will appreciate this wonderfully organized summary and explanation of linear slope. Approaching slope as it looks in a table of values, on a graph, in an equation, and between two points, this note sheet is...
Curated OER
Writing Equations from a Table
Students use coordinates in a table to write equations. In this algebra lesson, students discuss rate of change as it relates to slope and x and y values. They plot the points from a table to graph their lines and write an equation for...
Inside Mathematics
Swimming Pool
Swimming is more fun with quantities. The short assessment task encompasses finding the volume of a trapezoidal prism using an understanding of quantities. Individuals make a connection to the rate of which the pool is filled with a...
5280 Math
Step by Step
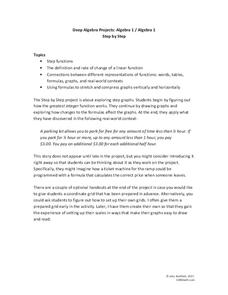
One step at a time! A seemingly linear relationship becomes an entirely new type of function. Young scholars build their understanding of step functions by completing a three-stage activity that incorporates multiple representations of...
Wordpress
Introduction to Exponential Functions
This lesson begins with a review of linear functions and segues nicely over its fifteen examples and problems into a deep study of exponential functions. Linear and exponential growth are compared in an investment task. Data tables are...
Curated OER
Taking Its Toll
Students explore ratios. For this rates lesson, students create a ratio to compare the price of a toll to the distance travelled. They compute the average cost per mile, determine the slope between two ordered pairs, and make...
101 Questions
Snow Day
Who doesn't like a snow day? Learners watch a snow accumulation over a span of 10 hours. They use that information to make a prediction of the total snow that fell during the 23-hour snowfall. Will it be enough to cancel school?
Noyce Foundation
Snail Pace
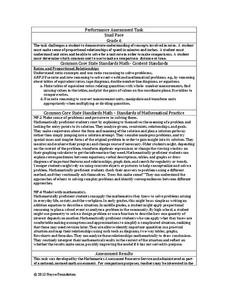
Slow and steady wins the race? In the assessment task, scholars calculate the rates at which different snails travel in order to find the fastest snail. Hopefully, your class will move much more quickly in finishing the task!
Sri Atmananda Memorial School
Rising Water
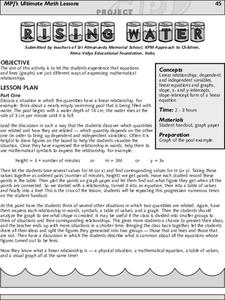
An engaging, and not to mention attractive, lesson plan has prealgebra and beginning algebra scholars examining linear relationships. They consider the rising water level as a swimming pool is being filled. They do so by charting and...
Curated OER
Linear and Exponential Functions
This comprehensive unit on linear and exponential functions provides numerous clearly-written worksheets. Topics include graphing linear equations, solving systems of equations algebraically and by graphing, identifying the domain and...
Curated OER
More Graphing Situations by Making a Table
Students calculate rate of change and graph linear functions. In this algebra lesson students write linear functions, make a table of points and graph their data on a coordinate plane. They calculate the rate of change of a graph.
Curated OER
Plotting Data Tables
Students make a table and plot their data on a graph. In this algebra instructional activity, students graph piecewise functions using the given equations along with the restricted domain. They calculate the rate of change.
Willow Tree
Line Graphs
Some data just doesn't follow a straight path. Learners use line graphs to represent data that changes over time. They use the graphs to analyze the data and make conclusions.
Curated OER
The Euro: Money Changes Everything
Students explore the impact of the euro on nations of the European Union (EU). In this euro instructional activity, students examine exchange rates within the EU as well as outside the EU in order to better understand the implications...
EngageNY
Linear and Exponential Models—Comparing Growth Rates
Does a linear or exponential model fit the data better? Guide your class through an exploration to answer this question. Pupils create an exponential and linear model for a data set and draw conclusions, based on predictions and the...
Charleston School District
Review Unit 3: Functions
Time to show what you know about functions! The review concludes a series of nine lessons on the basics of functions. The problems included are modeled from the previous lessons. Pupils determine if a table represents a function,...
EngageNY
Comparing Linear and Exponential Models Again
Making connections between a function, table, graph, and context is an essential skill in mathematics. Focused on comparing linear and exponential relationships in all these aspects, this resource equips pupils to recognize and interpret...
Curated OER
Linear Equations
Pre-algebra pupils examine the rate of change and how we can interpret it as a linear function. They are introduced to slope-intercept equations and graphs. Plenty of instruction is provided along with example problems. Note that even...


