Curated OER
Linear and Exponential Functions
This comprehensive unit on linear and exponential functions provides numerous clearly-written worksheets. Topics include graphing linear equations, solving systems of equations algebraically and by graphing, identifying the domain and...
Mathematics Vision Project
Module 4: Linear and Exponential Functions
Sequences and series are traditionally thought of as topics for the pre-calculus or calculus class, when learners are figuring out how to develop limits. But this unit uses patterns and slopes of linear functions in unique ways...
Mathematics Vision Project
Module 7: Modeling with Functions
The sky's the limit of what you create when combining functions! The module begins with a review of transformations of parent functions and then moves to combining different function types using addition, subtraction, and...
Curated OER
Describing Data
Your learners will practice many ways of describing data using coordinate algebra in this unit written to address many Common Core State Standards. Simple examples of different ways to organize data are shared and then practice problems...
Sophia Learning
Sophia: Find Slope and Rate of Change
This learning tutorial demonstrates how to find the slope of a line and the rate of change for a table. The lesson includes several PowerPoint presentations about slope and even provides practice problems for students to test their...
CK-12 Foundation
Ck 12: Algebra: Rates of Change
[Free Registration/Login may be required to access all resource tools.] Find the rate of change associated with real-world scenarios.
CK-12 Foundation
Ck 12: Analysis: Average Rate of Change
[Free Registration/Login may be required to access all resource tools.] Defining average rate of change and evaluating simple examples
CK-12 Foundation
Ck 12: Algebra: Rates of Change
[Free Registration/Login may be required to access all resource tools.] Learn how to solve problems involving rates of change.
Texas Education Agency
Texas Gateway: Developing the Concept of Slope
Given multiple representations of linear functions, the student will develop the concept of slope as a rate of change.
Sophia Learning
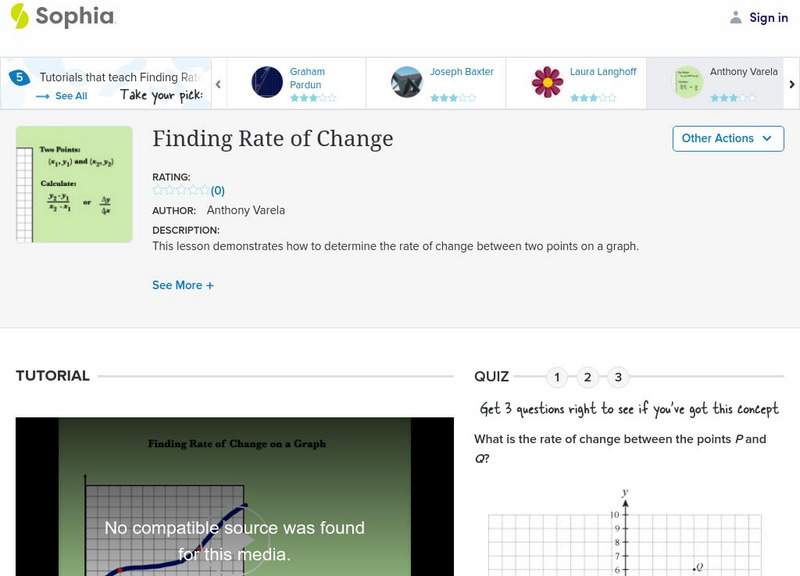
Sophia: Finding Rate of Change: Lesson 4
This lesson demonstrates how to determine the rate of change between two points on a graph. It is 4 of 5 in the series titled "Finding Rate of Change."
PBS
Pbs: The Lowdown: Analyzing Functional Relationships: An Equitable Society?
In this interactive, explore data presented in a series of graphs to evaluate whether we are any closer to having an equitable society than we were in 1963, the year of the historic March on Washington. In the accompanying classroom...
PBS
Pbs: The Lowdown: Poverty Trends: What Does It Mean to Be Poor in America?
Use math to learn about changes in US wealth distribution and poverty rate over time in this interactive from KQED. In the accompanying classroom activity, students interpret the graphs and consider how the poverty rate spike following...
PBS
Pbs: The Lowdown: Made in America: The High Cost of Fashion
Investigate data on changes over time in where our apparel is made and how much we spend on it in these images from KQED. In the accompanying classroom activity, students use the interactive and graph the data. They also look for...
PBS
Pbs: Modeling the Linear Relationship Between Fahrenheit and Celsius
Explore the relationship between degrees Fahrenheit and degrees Celsius. This video focuses on developing an expression to model the relationship between the temperature scales using a line graph to calculate slope and the y intercept.
PBS
Pbs: The Lowdown: What You Need to Know About Immigration Reform
Interpret graphs showing changes over time in the percentage of foreign-born US residents and in annual deportations in this interactive from KQED. In the accompanying classroom activity, students use the interactive and look at how...


