Curated OER
Using Data
In this analyzing data worksheet, 4th graders read, study and interpret a bar graph on how many hours Millie spends a week drawing each day. Students answer 2 short answer questions relating to the bar graph.
Curated OER
Population Patterns
Students study patterns of population growth in an ecosystem and why populations must remain in balance. They interpret basic population graphs and suggest scenarios about different population growth patterns in an ecosystem.
Curated OER
Big Block of Chocolate
Pupils read the book Big Block of Chocolate and complete language arts activities associated with it. In this language arts lesson plan, learners read the book as a read aloud or shared reading, and can compete writing, reading,...
Curated OER
My Test Book: Tally Charts
For this online interactive math worksheet, students solve 10 problems that require them to read and interpret tally chart data. Students may submit their answers to be scored.
Curated OER
Frequency Table
In this frequency table worksheet, students create a frequency table from given data. They identify the mode. Students read and interpret frequency tables. This one-page worksheet contains 7 multi-step problems.
Curated OER
If Our Class Went to See the Prince
First graders read the story One Monday Morning and create picture graphs based on the number of teachers, boys, and girls that would visit the prince. In this data lesson plan, 1st graders interpret tables and graphs with the help of...
Curated OER
Graphing Favorite Fruit
Third graders take poll and sort data, enter the data to create a spreadsheet and create bar and pie graphs.
Curated OER
Quad Squad
Students pretend they have visited a forest research station on an overnight field trip. They study forest fires, use compass directions, read maps, interpret imagery, and think about the impact of fire on ecosystems.
Curated OER
Kindergarten Money
Students identify the various coins and their values through presentations, a rubric, a value pretest, and coin manipulatives. Money is incorporated into various activities whether at home or in school. Students create money webs using...
Curated OER
The Perfect Principal
Students demonstrate their understanding of math skills. In this data analysis lesson, students complete a worksheet requiring them to calculate mean, median, and mode, and create and interpret graphs. Lesson is intended as an assessment...
Curated OER
Latent Heat of Fusion
Students conduct a series of investigation on latent heat of fusion. In this chemistry lesson, students explain how thermal storage systems work. They draw and interpret graphs.
Curated OER
Water: From Neglect to Respect
The goal of this collection of lessons is to make middle schoolers more aware of the ways in which they are dependent upon water to maintain their standard of living. Learners compare water use in Lesotho to water use in the United...
Illustrative Mathematics
Downhill
A car traveling down a steep hill is the model for this resource. The confusion comes when the elevation, E, is given in terms of distance, d. The distance, d, is the horizontal distance from E. Therefore, the equation, E = 7500 – 250d,...
Curated OER
WebQuest: Thrills and Spills- Pick Your Park!
Pupils participate in a WebQuest in which they must determine which amusement park is the "median priced" park. Students visit park websites to accumulate prices for parking, activities, restaurants, and gift shops.
Illustrative Mathematics
Robot Races
Analyze data on a graph to answer three questions after a robot race. Learners practice comparing ratios and reading points on a graph. Answers may vary on the last question based on accuracy of graphing. Use the lesson along with...
Curated OER
Student Costs Data Table
Learners compare and contrast two routes selected for a virtual field trip. They create a data table of educational activities, lodging, and meal costs using Microsoft Excel software.
Curated OER
Synthesis of Information
Locating and synthesizing information is an essential part of the research process but can be overwhelming for many young writers. Eliminate some of the stress and confusion, this resource suggests, by separating these steps. To focus...
Curated OER
Table Interpretation
Students solve problems using graphs to list and interpret data. Each student construct his or her own graph using art paper and markers. They be given a set of information to apply to their graphs and interpret their findings.
Curated OER
Graphing and the Coordinate Plane
Students gain practice reading coordinates and plotting points by participating in the Coordinates! Game. They demonstrate and test their skills with graph paper and the Maze Game.
Curated OER
Graphing Data from the Chemistry Laboratory
Young scholars graph and analyze data using a spreadsheet.
Curated OER
Problem Solving 1
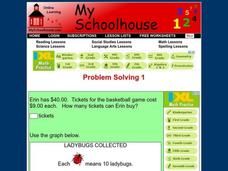
For this online interactive problem solving worksheet, students read a graph and use their problem solving skills in order to respond to 10 questions.
Curated OER
Numbers
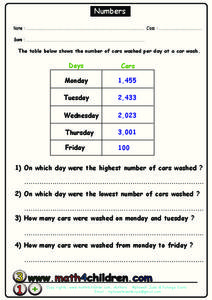
In this comparing numbers worksheet, students read the graph that shows the number of cars washed per day at a car wash. Students then compare the numbers by answer the questions.
Curated OER
Organizing and Interpreting Data
For this organizing and interpreting data worksheet, students solve and complete 10 different problems related to reading various data tables. First, they complete the 3 charts shown with the correct tally amount, frequency amount, and...
Curated OER
Plotting Wind Speed and Altitude
Young scholars construct, read and interpret tables, charts and graphs. They draw inferences and develop convincing arguments that are based on data analysis. They create a graph displaying altitude versus wind speed.

