Curated OER
Cause and Effect
Third graders investigate cause and effect. In this cause and effect lesson, 3rd graders read a story and determine what are the causes and effects. Students match sentence strips to the make the correct cause and effect sentence....
Curated OER
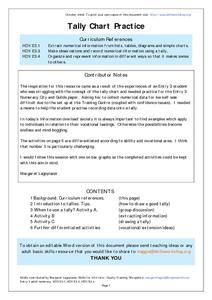
Tally Chart Practice
In this tally chart worksheet, students will read about tally charts and their uses. Students will make a list of when and why they could make a tally chart. Next students will complete a tally chart and write statements about the...
Curated OER
Practice with Experiment Conclusions
In this conclusions worksheet, students write one sentence to summarize the data given to them in a graph. Students complete 3 problems.
Curated OER
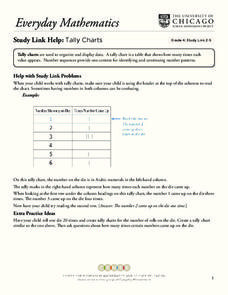
Tally Charts
In this tally charts worksheet, students discuss how to use a tally chart and how to read the chart. Once students record information on a tally chart they answer questions showing their ability to read a tally chart.
Curated OER
Bus Graph
Students make predictions about which bus takes the most/least students in the classroom. They use KidPix bus stamp for each student who goes home on that bus number and record data and discuss predictions.
Curated OER
Creating a Graph
Fifth graders learn information can be organized in different ways to make it easy to read and understand. Students pretend it is their summer vacation and think about their favorite thing to do. After brainstorming, 5th graders survey...
Curated OER
Cost analysis
For this Algebra I worksheet, 9th graders analyze a problem in which basic assumptions must be made about cost and demand for the product or item. Students use a graph to make predictions and determine the best price at which to sell an...
Education World
The African American Population in US History
How has the African American population changed over the years? Learners use charts, statistical data, and maps to see how populations in African American communities have changed since the 1860s. Activity modifications are included to...
Alabama Learning Exchange
Coordinate Geometry
Where do the coordinates lead? As children brainstorm ways to find the location of different buildings, they learn about coordinate points and how to use them to locate areas on a grid or map. They practice using ordered pairs by playing...
Florida Center for Reading Research
Phonological Awareness: Syllables, Syllable Say
Counting syllables can be fun when it's done with a friend. In pairs, learners say words as their partner counts the syllables they hear.
Curated OER
Single Event Upsets in Aircraft Avionics
In this aircraft avionics activity, science fans read about the first unmanned air vehicle that collects data about the Earth and is subject to damage by cosmic ray showers. Pupils analyze two graphs of data showing the neutron flux vs....
Miami University
Chapter Nine Worksheet: Monopoly
Advanced economics pupils analyze a series of graphs, data sets, and profit scenarios all related to monopolies and marginal revenue. They read through the background information, complete a graph using the data provided, and justify...
Curated OER
Matrix Madness!!
Perform operations to add, subtract, multiply and divide matrices. Then solve problems with vectors using matrices. A three day lesson: Matrix Madness, Mystical Matrices, and Decode the Encode. The last lesson has prizes that the class...
Curated OER
Slanted Surveys And Statistics
Students engage in a lesson that is concerned with the use of statistics and surveys and how they should be read. They create a survey and take it home to collect data. Then students display the data on a graph that is displayed in class.
MCAS Mentor
Number Sense and Operations
In this number sense and operations worksheet, learners solve 15 different types of problems that include reading number lines and solving inequalities. First, they write the scientific notation of various numbers given. Then, pupils...
Curated OER
Anything Worth Doing Is Not Necessarily Worth Doing Well
Provide your class with information on basic economic concepts using this resource. Learners read background
information, examine a graph, and answer seven questions about marginal benefits and costs.
Curated OER
Supply Curves, Moves Along Supply Curves, and Shifts in Supply Curves
Have your class explore the topic of supply and demand using this resource. Learners read background information, plot information on a graph, solve problems, and answer questions about this topic.
Curated OER
Chapter 17: Economic Growth and the New Economy
Is economic growth necessary to remain a relevant world power? These slides discuss the definition and implications of growth economics, complete with global comparisons and ways to account for growth. Graphs and charts are easy to read...
National Geographic
Altitude: What's in the Air?
Introuduce your scientists to the differences in air at varying altitudes with a colorful explanatory graph. After some discussion, they view unbelievable footage of mountain-climbing Leo Houlding and a narrative about how he might do...
Baylor College
What is Blood Pressure?
Find out how we describe the force created by the blood against the walls of the vessels in a heart-pumping lesson! As part of a unit on the heart and circulatory system, cardiology kids use a blood pressure monitor to find their...
The New York Times
Understanding the Mathematics of the Fiscal Cliff
What exactly is the fiscal cliff? What are the effects of changing income tax rates and payroll tax rates? Your learners will begin by reading news articles and examining graphs illustrating the "Bush tax cuts" of 2001 and 2003. They...
Bridges In Mathematics
Grade 2 Comprehensive Growth Assessment
Need to know if your students comprehend all the Common Core standards covered in second grade? This growth assessment will let you know. Find out if your second graders can add/subtract, tell the time, read a bar graph, know their...
McGraw Hill
Neutron Stars Interactive
The universe is full of sources of energy. Explore the energy of pulsars with your classes through a simulation. An interactive lesson allows learners to manipulate the angle of rotation of both the earth and the pulsars. A real-time...
Centers for Disease Control and Prevention
Major Disparities in Adult Cigarette Smoking Exist Among and Within Racial and Ethnic Groups
Data indicates that some racial groups smoke more than others, and that with that racial group, there are smaller groups whose smoking habits vary as well. Secondary learners read a graph that details the differences between the Asian...


