Curated OER
Quiz: Reading and Making Line Plots
In this reading and making line plots instructional activity, students create a line plot for given sets of numbers. In addition, they read graphs and interpret the average. This one-page instructional activity contains ten problems.
CPO Science
Physics Skill and Practice Worksheets
Stop wasting energy searching for physics resources, this comprehensive collection of worksheets has you covered. Starting with introductions to the scientific method, dimensional analysis, and graphing data, these skills practice...
Math Worksheets Land
Halloween Cartesian Art: Bat
Get the class batty over graphing. Young mathematicians plot ordered pairs in all quadrants of a Cartesian plane, and connect the points to create a bat.
Curated OER
Use a Graph
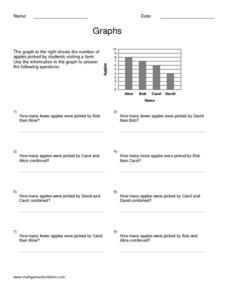
Information is often presented in graph form. Can your youngsters read a basic bar or picture graph? Six word problems accompany three graphs. One graph is a bar graph and the other two are pictographs.
Curated OER
Graphs to Represent a Data Set
By analyzing a word problem about hours worked in a week, scholars get valuable practice with bar graphs and data analysis. They read the scenario, then examine a table of data taken from it. The data includes four days and the...
Curated OER
Line Plot Touchdowns
In this line plots worksheet, students read the number of touchdowns that were scored in Super Bowl Games from 1990-2000. Students use the line plots to answer the questions.
Curated OER
Presentation of Quantitative Data- Vertical Line Diagrams
In this quantitative data worksheet, students examine how vertical line diagrams can be used to display discrete quantitative data. They read about the use of tally charts to create vertical line graphs that display the data. They...
Teach Engineering
Matching the Motion
It is not always easy to walk the straight and narrow. In the sixth portion of a nine-part unit, groups actively recreate a graph depicting motion. Individuals walk toward or away from a motion detector while trying to match a given...
Curated OER
Walking the Plank
This is a cool math activity. Kids collect and interpret data based on a physical act. A board is balanced between a scale and a step, learners record a peer's weight as it decreases while s/he walks further away from the scale. They...
Math Drills
Thanksgiving Cartesian Art: Turkey
What does a turkey like to eat on Thanksgiving? Nothing, it's already stuffed. Turkey enthusiasts graph points on a Cartesian coordinate system
Curated OER
Graphs
In this graphing worksheet, 9th graders read one page of graphing examples and complete 8 exercise problems. Each problem involves graphing and coordinates.
Curated OER
Lesson 6-7: Scatter Plots and Equations of Lines
In this scatter plot worksheet, students examine tables and write a linear equation that matches the table. Students graph linear equations. They read scatter plots, determine the trend line, and write a linear equation to match...
Curated OER
Graphs
In this graphing worksheet, students read information and study diagrams about graphing. Students complete 3 graphing activities.
Curated OER
Chapter 3 Review
In this review worksheet, students read circle graphs and line graphs. They identify quadrants in a coordinate plane and match graphs to their appropriate linear equation. Students find the slope of a line and identify the y-intercept....
Curated OER
Data Analysis 2
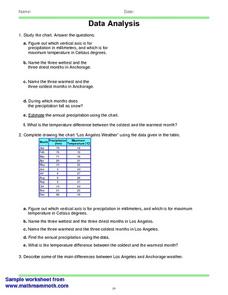
In this data analysis worksheet, learners read and interpret given line graphs. They determine the range and average. This one-page worksheet contains five problems.
Curated OER
Let's Line Them Up!
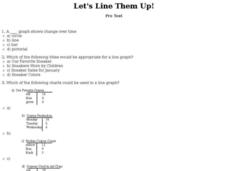
In this line graph instructional activity, students read through the problems about graphing and line graphs. Students select the best answer to solve the 10 online questions.
Royal Baloo
Star Wars K-2nd Math Pack
Included in a Star Wars themed packet, young padawans enhance mathematical skills such as graphing, computing using basic operations, counting numbers and money, telling time, and measuring. Scholars play a game of sudoku, read number...
Curated OER
Charts and Graphs
For this charts and graphs worksheet, students refer to charts and graphs to solve word problems. Students complete 10 multiple choice word problems.
Illustrative Mathematics
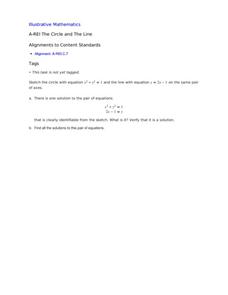
The Circle and The Line
Here is a resource where algebra learners show their understanding of a system of equations involving a circle and a line. Once graphed, learners see two points of intersection, one where the ordered pair is read, and a second where...
Curated OER
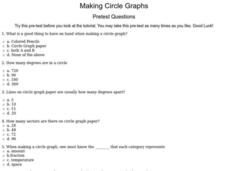
Making Circle Graphs
In this circle graphing learning exercise, 6th graders answer ten multiple choice questions based on their knowledge of circle graphs. This is an interactive learning exercise.
Inside Mathematics
Population
Population density, it is not all that it is plotted to be. Pupils analyze a scatter plot of population versus area for some of the states in the US. The class members respond to eight questions about the graph, specific points and...
Inside Mathematics
Scatter Diagram
It is positive that how one performs on the first test relates to their performance on the second test. The three-question assessment has class members read and analyze a scatter plot of test scores. They must determine whether...
EngageNY
Geometric Interpretations of the Solutions of a Linear System
An intersection is more than just the point where lines intersect; explain this and the meaning of the intersection to your class. The 26th segment in a 33-part series uses graphing to solve systems of equations. Pupils graph linear...
Inside Mathematics
Sorting Functions
Graph A goes with equation C, but table B. The short assessment task requires class members to match graphs with their corresponding tables, equations, and verbalized rules. Pupils then provide explanations on the process they used to...


