Hi, what do you want to do?
Curated OER
Measuring the Speed of a Wave
Students create an experiment in which they measure the speed of a wave and record the data in a graph. They work in small groups to write the procedure for the experiment and share it with another group for cross checking of the...
Mathed Up!
Stratified Sampling
Young mathematicians learn how to solve problems involving stratified sampling. They review concepts of sampling and proportionality by watching a video and then they complete a activity of questions on this topic.
Curated OER
Count The Letters
Students perform activities involving ratios, proportions and percents. Given a newspaper article, groups of students count the number of letters in a given area. They use calculators and data collected to construct a pie chart and bar...
Discovery Education
Sonar & Echolocation
A well-designed, comprehensive, and attractive slide show supports direct instruction on how sonar and echolocation work. Contained within the slides are links to interactive websites and instructions for using apps on a mobile device to...
Curated OER
Yummy Math
Young mathematicians use bags of Skittles to help them gain practice in graphing and organizing data. They work in pairs, and after they have counted and organized their Skittles, they access a computer program which allows them to print...
Curated OER
Sampling Snoops
Students practice formulating a hypothesis and designing an experiment to test the hypothesis. They identify several sampling techniques they can use to test their hypotheses.
Curated OER
Show Me!
Students analyze and interpret graphs. In this graphing instructional activity, students view a video and construct their own graphs (line, circle, bar) from given sets of data.
Curated OER
Immigration Graphs
Fourth graders study immigration. In this graphing instructional activity, 4th graders make a population graph of people who have immigrated to Indiana.
Curated OER
Fractions
Fourth graders explore fractions. They use Skittles and M&M's to practice adding and subtracting fractions. Students review the numerator and the denominator of fractions. They count the number of each color of Skittles and M&M's...
Curated OER
Statistics Newscast in Math Class
Students study sports teams, gather data about the teams, and create a newscast about their data. In this sports analysis instructional activity, students research two teams and define their statistical data. Students compare the two...
Curated OER
Graphing
Young scholars investigate graphing. In this bar graph instructional activity, students view an informational website about graphing, then construct a class birthday bar graph outside with sidewalk chalk. Young scholars choose a...
Curated OER
How can my breakfast help the birds?
Sixth graders design farms with a bird's habitat in mind. In this farm lesson plan, 6th graders research how sun grown coffee destroys a bird habitat, and then they make their own farm with a bird's habitat being preserved. They then...
Curated OER
Kindergarten-sight Words Fall Colors
Students listen to the poem Fall Colors and find their favorite Fall color. In this Fall color lesson, students recognize the Fall color words. Students make leaf prints with their favorite colors. Students talk about their...
Curated OER
What's Your Favorite Planet?
Fourth graders interpret a graph and make correlations using data. After taking a class survey, 4th graders create a class graph of their favorite planets. Working in small groups, they interpret the information and create at least ten...
Curated OER
Comparison of Snow Cover on Different Continents
Students use the Live Access Server (LAS) to form maps and a numerical text file of snow cover for each continent on a particular date. They analyze the data for each map and corresponding text file to determine an estimate of snow cover...
Curated OER
Aruba Cloud Cover Measured by Satellite
Learners analyze cloud cover and to compose written conclusions to a given related scenario. They submit a letter of response and a report detailing their calculations and conclusions.
Curated OER
Whose Breakfast isn't for the Birds?
Students explore coffee production. In this cross-curriculum rainforest ecology instructional activity, students research regions where coffee comes from and investigate how the native birds in the rainforest are effected by coffee...
Curated OER
Characteristics of Arthropods
In this arthropods worksheet, high schoolers will review arthropod exoskeletons, jointed appendages, molting, and types of respiratory structures. Students will also review arthropod senses, body systems, and reproduction. This worksheet...
Curated OER
Childhood Obesity
Learners identify a question to generate appropriate data and predict results. They distinguish between a total population and a sample and use a variety of methods to collect and record data. Students create classifications and ranges...
Curated OER
Explore: Collect And Organize Data
In this exploring how to collect and organize data worksheet, students, working with a partner, problem solve the answers to seven word problems involving data.
Curated OER
Snow Cover By Latitude
Pupils examine computerized data maps in order to create graphs of the amount of snowfall found at certain latitudes by date. Then they compare the graphs and the data they represent. Students present an analysis of the graphs.
Curated OER
Scavenger Hunt
Pupils collect data about lighting conditions around a room using a light sensor and RCX. They use software to upload and analyze the data in order to draw conclusions about light intensity in the room.
Khan Academy
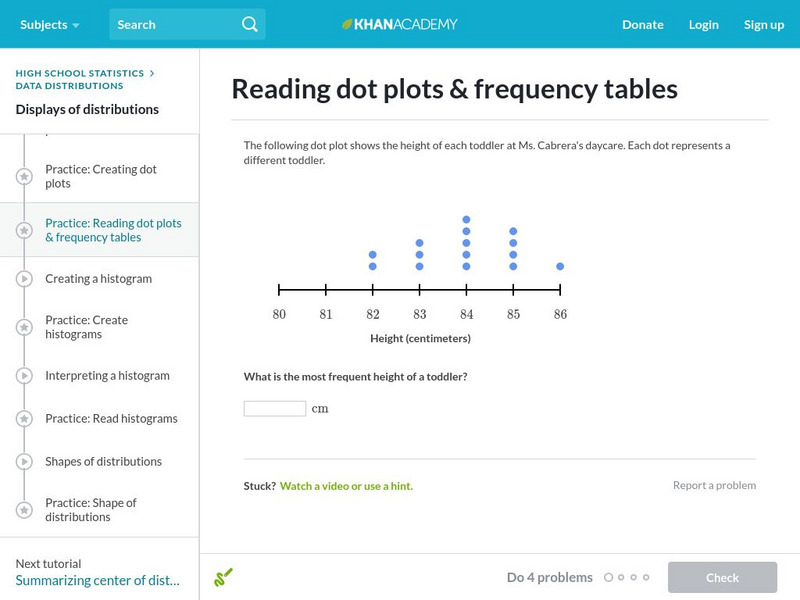
Khan Academy: Reading Dot Plots & Frequency Tables
Practice reading basic dot plots and frequency tables. Students receive immediate feedback and have the opportunity to try questions repeatedly, watch a video or receive hints.
Khan Academy
Khan Academy: Reading Dot Plots and Frequency Tables
In this exercise, students practice reading dot plots and frequency tables. Students receive immediate feedback and have the opportunity to get hints and try questions repeatedly.


