Curated OER
Ocean Botttom Profile
Students interpret a graph of ocean depths and topographic features. This task assesses students' abilities to interpret figures, organize and represent data, apply knowledge of scale to a profile, and apply theoretical knowledge.
Curated OER
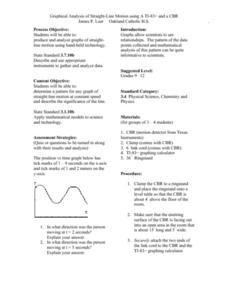
Graphical Analysis of Straight-Line Motion
Students investigate the concept of straight line motion. They determine the pattern and graph it looking for the motion maintained at a constant speed. Students also write a description of the significance of the line. The skill of...
Curated OER
Mapping a Temperature Field
Students measure and graph temperatures. In this temperature field lesson students use a map to measure and plot field values and construct isolines and interpret the results.
Curated OER
Building a Pill Bug Palace
Learners make "pets" of isopods (potato bugs) to determine their preferred environment and food sources. They record their results on a bar graph and in a scientific report.
Curated OER
Hudson River Salt Front Activity
In this Hudson River worksheet, students read a passage about the Hudson and salinity, they complete graph interpretation and questions and activities.
Center of Excellence for Science and Mathematics Education
A Sick Astronaut
Aspiring astronauts graph, interpret, and analyze data. They investigate the relationship between two variables in a problem situation. Using both graphic and symbolic representations they will grasp the concept of line of best fit to...
Curated OER
Conducting a Scientific Investigation
Students investigate a possible health problem in the local school district through inquiry into attendance records, activities, maps, graphs, and data tables. The simulation continues as solutions for the problem are sought.
Curated OER
Measuring Biodiversity
Young scholars collect species data from a mock intertidal community. In this biology lesson, students graph their data and analyze the species in it. They construct a species accumulation curve and present it to class.
Curated OER
Show Me!
Students analyze and interpret graphs. In this graphing instructional activity, students view a video and construct their own graphs (line, circle, bar) from given sets of data.
Curated OER
The Blizzard of 1993
Students read and interpret the information from a barograph from a major winter storm. This task assesses students' abilities to interpret and analyze graphs, construct data tables and graphs, generalize, infer, apply knowledge of...
Curated OER
Heart Rate Graphs
In this graphing activity, 5th graders use a line graph to compare and contrast the heartbeats of two athletes in a tennis match.
Curated OER
Growing and Graphing
Students visit a 2nd and a 4th grade class to measure the heights of older students using large building blocks as a non-standard unit of measure. They can also measure adults in the school community. Results are displayed in...
Curated OER
Prediction
Students' recognize the various roles of predicting in science. Students' practice making and interpreting predictions; experimenting to test their hypotheses; and refine their predictions based on observation and experimentation....
Curated OER
Exploring Wyoming Species Habitats
Students are introduced to the concept of species habitats and ranges. They introduced to ArcView GIS as a tool for mapping. Pupils use query data for species withina county, elevation, range, rivers and streams, land cover, and etc....
Virginia Department of Education
Hurricanes: An Environmental Concern
Hurricanes, typhoons, and tropical cyclones are the same type of storm, but their names change based on where they happen. Scholars use a computer simulation to learn about hurricanes. Then they hypothesize ideas to prevent hurricanes...
University of California
Heating and Cooling of the Earth's Surface
Scholars collect data from heating sand and water before forming testable hypotheses about why sand heats up faster. Afterward, they develop and run experiments to test their hypotheses.
Prince William Network
Migration Headache
During this game, kids become migratory shorebirds and fly among wintering, nesting, and stopover habitats. If they do not arrive at a suitable habitat on time, they do not survive. Catastrophic events are periodically introduced that...
Curated OER
How High Are the Clouds?
Students analyze height and collect data to create a graph. In this statistics instructional activity, students use central tendencies to analyze their data and make predictions. They apply concept of statistics to other areas of...
Curated OER
Lahar Travel Time
Ninth graders analyze published geologic hazard maps of California and comprehend how to use the map's information to identify evidence of geologic events of the past and present and predict geologic changes in the future. They select...
Curated OER
The Lake Effect
Fourth graders conduct an experiment demonstrating the effects of water and air temperature on precipitation. They create graphs demonstrating their findings using Claris Works for Kids.
Curated OER
Impact!!
Learners perform a science experiment. In this algebra instructional activity, students collect data from their experiment and create a graph. They analyze the graph and draw conclusion.
Curated OER
Learning to Make Data Tables
Students construct data tables using the results of previous experiments. In this graphing lesson, students plot data and interpret the results. Students discuss how they organized their data.
Curated OER
Technology Literacy Challenge Grant Learning Unit
First graders explore counting and classification. They sort leaves, create graphs, write sentences for the data in the graphs, develop graphs for shapes, favorite animals, birthdays, and participate in a die prediction game.
Curated OER
Bird Feeding and Migration Observation
Students research bird migration and build a bird house. In this bird lesson plan, students research the birds in their area and where they migrate to. They also build their own bird house and record data on what kinds of birds come to...

