Curated OER
The Sun's Energy
Sixth graders examine how the sun's energy arrives as light with a range of wavelengths. They discuss the characteristics of light, examine the color of light using a spectroscope, and conduct an experiment using water and thermometers....
Curated OER
Schoolyard Bird Project
Middle schoolers observe and count bird sightings around their schoolyard throughout the school year.
Curated OER
The Mysteries of El Nino: How Much do We Really Know?
Seventh graders investigate the causes and effects of El Nino and explore its global impact on weather related occurrences through this series of activities.
Curated OER
Wing Specifications
Ninth graders use FoilSim to fulfill the specifications of a given airfoil (wing) and plot and interpret graphs.
Curated OER
Glacial Change
Students research the ways in which scientists study glaciers and glacial change. They interpret real time data and calculate the estimated global sea level rise potential. A very good lesson to illustrate global warming.
Curated OER
Streamflow
Students discuss the topic of streamflow and how it occurs. They take measurements and analyze them. They interpret data and create their own charts and graphs.
Curated OER
Scientific Inquiry: Periodic Motion
Young scholars construct their own pendulum. In this physics lesson, students design an experiment to find the factors affecting its period. They formulate a conclusion based on experimental data.
Curated OER
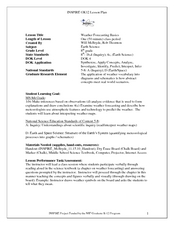
Weather Forecasting Basics
Eighth graders analyze weather diagrams and weather maps. In this earth science lesson, 8th graders explain why it is important to know the weather. They complete a handout at the end of the lesson.
Curated OER
Circle the Earth - Explore Surface Types on a Journey around Earth
Students use CERES percent coverage surface data with a world map in locating landmasses and bodies of water at Earth's Equator.
Curated OER
Water-Is There Going to be Enough?
Students research the availability, usage and demand for water in the local area historically and use projections of the availability, usage and demand for water up to the year 2050. They gather data and present the information in...
Curated OER
On the Surface
Students draw and label the 15 major rivers in Texas. They then draw and label another map with the major lakes and reservioirs of Texas. Students use the maps and locate and label the location of the following major Texas cities:...
Curated OER
Dimming the Sun
Students collect, interpret and analyze weather variable data. They describe atmospheric variables that affect evaporation. Students create graphs and analyze the information collected.
Curated OER
A Tasty Experiment
Students work together to determine if smell is important to being able to recongize food by taste. They try different foods with different textures and hold their nose. They create a graph of their results.
Curated OER
Sea Surface Temperature Trends of the Gulf Stream
Students use authentic satellite data to produce plots and graphs of sea surface temperature as they explore the seasonal changes of the Gulf Stream.
Curated OER
Sea Surface Temperature Trends of the Gulf Stream
Students explore the importance of the Gulf Stream. Using a NASA satellite images, they examine the sea surface temperature. Students collect the temperature at various locations and times. Using spreadsheet technology, they graph the...
Curated OER
Sunspots and Climate
Students make a graph that shows how the number of sunspots has changed over the past 30 years and discover how there is a pattern in sunspot number. They find a disruption in this pattern due to the Little Ice Age.
Curated OER
Stream Chemistry Monitoring
Students become familiar with real-world gathering of chemical data. The experience how the science is done: the nature of analysis, data collection, interpretation, and presentation. They study a nearby body of water for their experiment.
Curated OER
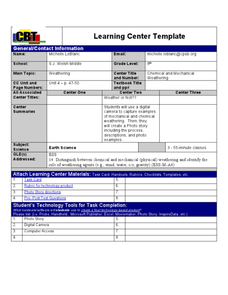
Weather... Or Not
Learners observe and discuss the local weather patterns, researching cloud types and weather patterns for cities on the same latitude on the Internet. They record the data for 6-8 weeks on a graph, and make weather predictions for their...
Curated OER
Kincaid Shelter Stratigraphy
Seventh graders illustrate how archeologists use stratigraphy to help determine environmental changes in a specific area since the Pleistocene Era, and to point out that these changes have affected the animals living in that area.
Curated OER
Watershed Investigations
Students find maps of the region to show rock formations and soil types and use GIS to compare radon levels. They describe three types of radioactive decay, interpret graphs, and follow steps to develop a nuclear bomb or energy.
Curated OER
Melting and Freezing of Water
Students differentiate the three states of matter. In this chemistry instructional activity, students analyze graphs of heating and cooling curve of water. They complete a lab report and discuss results.
Curated OER
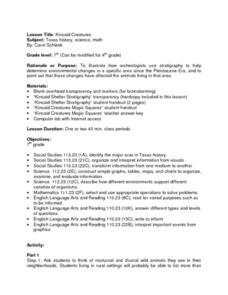
Kincaid Creatures
Students brainstorm a list of nocturnal and diurnal wild animals they see in their community and discuss how the animals would be different if they were living during the Ice Age. Using a handout, they discover how archeologists record...
Curated OER
Seasons' Journey: As the World Turns
Fourth graders explore the earth's revolution around the sun and the changes in weather that follow this motion.
Curated OER
Geography: Analyzing the Local Environment
Students, in groups, explore the school grounds and organize their findings according to the five themes of geography. They take notes and sketch the grounds. Students divide the school and grounds into regions based on use.


