Curated OER
Canada's Forests and Resource Management
Students are introduced to the Canadian forest industry so that they may assess the economic and environmental sustainability of the industry.
Curated OER
Galaxies
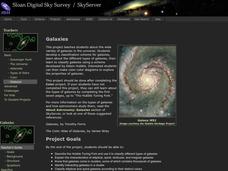
Students use the provided website to classify galaxies after exploring information about elliptical, spiral, lenticular, and irregular galaxies and using the Hubble Tuning Fork.
Curated OER
Awesome Animals
Students collect data from classmates about their favorite animal. They use the ClarisWorks graphing program to enter data, graph results, and interpret data.
Curated OER
Measuring "pHacts" about Acid Rain
Sixth graders gather and graph information regarding the pH of rain. Working cooperatively with an internet partner, 6th graders gather and record information about the pH of the rain in their local area. They graph this information...
Curated OER
Exploding Numbers
Students discuss how numbers increase when exponential growth is occurring. They view a video and compare exponential and linear growth with a graphing calculator.
Curated OER
Geography
Pupils work together in groups to research the cultural groups of West Africa, Sudan and the Guinea Coast. They compare and contrast each culture and locate the political and cultural boundaries on a map.
Curated OER
Michigan Fun Facts
Fourth graders work with a partner to plan, rese,a rch design and publish a
slide show that depicts the most important or interesting facts they
have learned about Michigan. They are given the choice of working in
one of the seven...
Curated OER
Newton's Third Law and Aircraft Propulsion
Students research propulsion, graph data, and interpret the results.
Curated OER
Mobile of Information
Pupils create a mobile of various geometric designs to be usend to display information from a variety of texts. They add graphics as well as graphs and charts, color, design and artwork to express the ideas learned through the different...
Curated OER
To Classify Beans And Peas
First graders record information on a bar graph and interpret the information given. They identify five different kinds of beans and three different kinds of peas. They work in groups of four and sort the beans by size or shape.
Curated OER
Home on the Biome
Fifth graders study six major biomes, graph temperature and rainfall, and present their findings to the class.
Curated OER
Looking through the Sands of Time: 80's Decade
Students view the comic "Time sliders" from the Celebrate the Stamp Unit from the 1980's. They discuss what the comic magazine contains. Students listen to a speaker from the post office discuss how stamps are selected. They use...
Curated OER
One Square Foot
Students identify, describe, count, tally, and graph life found in one square foot of land.
Curated OER
Class Final Report - Global Sun Temperature Project
Students reflect on the data they have analyzed during the Global Sun Temperature Project. They use the project website as a resource for their observations, draft a class report and post it on the Internet.
Curated OER
Comparing Ethnic Groups
Eleventh graders explore the relationship between the United States and the Native Americans from after the Civil War to the early 1900's. They evaluate the actions of the United States towards Native Americans and compare the actions to...
Curated OER
Weather for Health
Ninth graders encounter various types of numerical information (represented in multiple ways), much of which is abstract and difficult to comprehend. In this activity, 9th graders will convert given information into bar graphs. In the...
Curated OER
Hibernating Hoopla
Students simulate hibernation with their stuffed animals. They predict the length of time of hibernation and type their math journal entries about sorting, graphing and draw pictures. They read bear hibernation stories.
Curated OER
What Are The Characteristics of Your Neighborhood?
Students make a mental map of their neighborhood. Using a software program, they make an aerial and digital map of their school and locate their school on given maps. In groups, they calculate the distances to various locations and...
Curated OER
You Gotta Have Heart
Ninth graders investigate the concept of relations and interpret graphs and tables. They analyze given data and look for a pattern to determine if the numbers represent a function. Students practice solving scientific word problems that...
Curated OER
Classification
Second graders sort insects into groups by determining similar characteristics. They role play as Entomologists to sort insects.
Curated OER
Peekikng At Public Sculpture
Students use the internet to investigate public examples of sculpture. They reflect upon the possibility of being a reference of lifestyles that can exist in a society. A variety of media sources serve as inspiration for the lesson.
Curated OER
Math Lesson: How Many People Live There?
Students are able to calculate the population density of a country, and calculate the population density of large cities in that country. They are able to create an appropriate graph to represent their data for that country.
Curated OER
Perimeters, Patterns, and Conjectures
Learners discover patterns and write conjectures relating to perimeters and polygons. Working in cooperative learning groups, they use manipulatives and graphic organizers to solve problems then answer a series of questions in which they...
Curated OER
Exploration of Civil War Webquest
Students use the internet to research what life was like for Confederate and Union soldiers in a specific battle of interest to them. In groups, they complete a webquest on the battle in which one represents a Confederate soldier and the...

