Alabama Learning Exchange
How Old is Your Money?
Elementary learners explore coin mint dates. First, they listen to the book Alexander Who Used to be Rich Last Sunday by Judith Viorst. They then sort a collection of coins according to their mint date and put them in order from oldest...
Curated OER
Food chains at sea
Fifth graders interpret a table of data about food chains in the ocean. They create a food chain to represent the information on the table. Periwinkles eat seaweed, and crabs eat periwinkles - so who eats crabs? Extend the activity with...
Howard Hughes Medical Institute
Lactase Persistence: Evidence for Selection
What's the link between lactase persistence and dairy farming? Biology scholars analyze data to find evidence of the connection, then relate this to human adaptation. Working individually and in small groups, learners view short video...
Curated OER
Science as Inquiry: what is starch and how can we test it?
Sixth graders discuss nutrients and examine foods for starch. In this starch testing lesson plan, 6th graders use iodine to test foods for starch and record their results. Students complete a worksheet and self reflection.
Curated OER
Science in Focus: Force and Motion
Students explore force and motion through a series of experiments. In this physics instructional activity, students create and interpret speed graphs. They build an electromagnet and explain the factors affecting its strength.
Curated OER
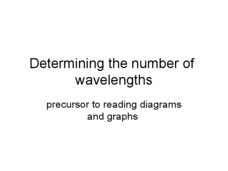
Determining the Number of Wavelengths
After displaying three diagrams showing 1, 1 1/2, and 2 wavelengths, the slide show presents more diagrams and expects pupils to determine the number of wavelengths in each. No labels or explanations are provided, so this would be useful...
Chicago Botanic Garden
Historical Climate Cycles
Scientists use ice core samples to obtain temperatures of the earth from 400,000 years ago! The third of five lessons instructs pupils to interpret historical climate data to see changes over time. In part I, participants interpret...
Curated OER
Applied Science - Science and Math Lab 4B
Learners experiment with the combination of vinegar and baking soda. In this applied science lesson, future scientists compare qualitative and quantitative data collected from their exploration. Then they work together to analyze and...
Baylor College
Body Mass Index (BMI)
How do you calculate your Body Mass Index, and why is this information a valuable indicator of health? Class members discover not only what BMI is and practice calculating it using the height and weight of six fictitious individuals, but...
Science 4 Inquiry
The Ups and Downs of Populations
As the reality of population decline across many species becomes real, pupils learn about the variables related to changes in populations. They complete a simulation of population changes and graph the results, then discuss limiting...
Michigan State University
Bug Lyphe!
Introduce ecology classes to biodiversity and interdependence in ecosystems with a PowerPoint presentation. Then, they get up-close and personal with the invertebrate world by collecting insects, classifying them, and graphing their...
Alabama Learning Exchange
There's Gold in Them There Hills
Need to build a laser fence on Mars? For this cute maximizing-area lesson, young explorers pretend to be prospectors on Mars and must determine the best way to use 20 meters of fencing in order to maximize their area. In addition,...
Chicago Botanic Garden
Historical Climate Cycles
Ice core samples give scientists access to climates of old—those from more than 800,000 years ago. Through an analysis of various temperature graphs from ice cores, tree rings, and weather stations, scholars compare historical climates...
Curated OER
Mathematics in Bioengineering: Its Application for Today's Students
High schoolers explore the different fields of bioengineering. They will create and interpret graphs from cancel cells data. They then calculate the amount of drugs found in blood and eliminated by the body over time.
Serendip
Changing Biological Communities – Disturbance and Succession
After cutting down a forest to make a farm, how long would it take the environment to turn an abandoned farm back into a forest? Scholars study this exact scenario while they interpret many charts and graphs of the changing ecosystems as...
Curated OER
Measuring Rainfall and Relationships Between pH, Alkalinity and Suspended Solids in the Pago River
Eleventh graders test the pH and alkalinity of Pago River. In this ecology instructional activity, 11th graders collect data and use spreadsheet to graph results. They analyze and share their findings with the class.
Curated OER
My Test Book: Stem and Leaf Plots
In this math skills learning exercise, students solve 10 multiple choice math problems which require they interpret a stem and leaf plot. Students may view the correct answers.
Curated OER
Making and Interpreting Tables
In this data tables instructional activity, middle schoolers make and interpret data tables given data about magazine sales. They categorize their data, complete their data table and answer questions about their data.
Curated OER
Weather, Data, Graphs and Maps
Students collect data on the weather, graph and analyze it. In this algebra instructional activity, students interpret maps and are able to better plan their days based on the weather reading. They make predictions based on the type of...
Curated OER
Leveled Problem Solving: Circle Graphs
In this circle graphs activity, learners solve 6 word problems based on a circle graph about the most popular classes for sixth graders. Students calculate angle measures of circles for 2 of the problems.
Curated OER
Graphing Weather
Students make a graph. In this weather lesson, students fill in a KWL chart about different types of weather. Students watch a PowerPoint presentation about weather and natural disasters and where these types of weather are common....
Curated OER
Graphing Linear Motion
In this graphing linear motion worksheet, students answer 20 questions about velocity of objects, the distance they travel and the time. They interpret a graph of position vs. time and identify the velocity at certain point on the graph.
Curated OER
Volcanic Activity in the U.S.
Young scholars locate and map ten volcanoes in United States, create chart comparing volcanoes by last eruption, type of volcano, location, and interesting fact, and create Powerpoint slide show describing basic
information about...
Curated OER
Linear Motion in Class Test Review
In this linear motion activity, learners answer 21 questions about acceleration, velocity, position and time. Students interpret graphs of position vs. time, velocity vs. time and acceleration vs. time. They calculate speed of objects,...


