Curated OER
Using Random Sampling to Draw Inferences
Emerging statisticians develop the ability to make inferences from sample data while also working on proportional relationships in general. Here, young learners examine samples for bias, and then use random samples to make...
Teacher's Corner
Hey Batter, Wake Up!
Does jet lag affect a baseball team's performance in games? Read about how a baseball team's chance of winning a game can be affected by traveling over one, two, and three time zones. Readers then respond to five short answer questions...
Curated OER
Bread in a Bag
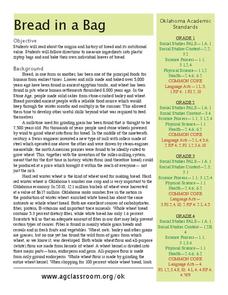
Could the history of bread really be interesting? Yes, it could! An informational text gives scholars wheat production background from 8,000 years ago, discussing different types of bread and the current industry in Oklahoma. Learners...
August House
Anansi Goes to Lunch - Kindergarten
Greed is the theme of the West African folktale, Anansi Goes to Lunch and this multidisciplinary collection of lessons. First, scholars listen to a read aloud and participate in a grand conversation about the book's key details and...
Curated OER
Arc GIS Project: Visualizing the Holocaust
A cross-curricular lesson for middle schoolers that covers language arts, social studies, geography, and math, this is a great extension activity if your class is reading The Diary of Anne Frank or learning about the Holocaust....
Balanced Assessment
Movie Survey
Movie preferences will get your classes talking! Individuals read a pie graph and construct a bar graph using the same information. They then answer questions specific to the data and sample size.
Education World
The African American Population in US History
How has the African American population changed over the years? Learners use charts, statistical data, and maps to see how populations in African American communities have changed since the 1860s. Activity modifications are included to...
Inside Mathematics
Scatter Diagram
It is positive that how one performs on the first test relates to their performance on the second test. The three-question assessment has class members read and analyze a scatter plot of test scores. They must determine whether...
Federal Reserve Bank
Arts and Economics Infographic Questionnaire
How do careers in the arts contribute to America's gross domestic product? Use an informative infographic that details the economic details of careers in the core arts, including design services, performing arts, and arts education, to...
Curated OER
Fish Communities in the Hudson
Learning to read data tables is an important skill. Use this resource for your third, fourth, or fifth graders. Learners will will study tables of fish collection data to draw conclusions. The data is based on fish environments in the...
Curated OER
Detective Fiction: Focus On Critical Thinking
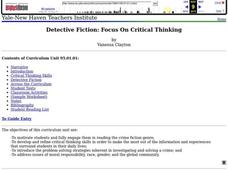
Turn your 6th graders into detectives while growing their love of reading. Using critical thinking skills, they will be able to describe the five basic elements of detective fiction, read detective novels, make predictions, use the...
New York State Education Department
TASC Transition Curriculum: Workshop 5
Are video games sports? Pupils investigate this question as well as various nonfiction selections to learn more about claims and the support that defines them. All of the selections mimic the rigor on state tests and encourage close...
Inside Mathematics
House Prices
Mortgages, payments, and wages correlate with each other. The short assessment presents scatter plots for young mathematicians to interpret. Class members interpret the scatter plots of price versus payment and wage versus payment for...
Visa
Make It Happen: Saving for a Rainy Day
Every little penny counts, especially when it comes to saving for emergencies or long-term goals. Pupils evaluate different saving and investment strategies, such as a CD or money market account, through worksheets and by...
Curated OER
Gathering Data to Problem Solve
Students, while using reading and writing strategies (subheads, prediction, skim, details, drawing inferences, etc,), solve math problems that involve gathering and representing data (addition, subtraction, multiplication). They practice...
Curated OER
What's the Best Deal?
Students explore number sense by solving consumer math problems. In this pattern identification lesson plan, students analyze a list of numerical and geometric patterns while predicting the future outcome. Students utilize inference...
Curated OER
Mr. Cobbler's Shoe Dilemma
Students employ statistics to solve real-world problems. They collect, organize and describe data. They make inferences based on data analysis. They construct, read, and interpret tables, charts and graphs.
Curated OER
The Dog Days of Data
Young scholars practice an alternative form of data presentation. They practice sequencing data, identifying the stem-and-leaf, creating stem-and-leaf plots, and drawing inferences from the data by viewing the plots.
Curated OER
The Dog Days of Data
Students are introduced to the organization of data This instructional activity is designed using stem and leaf plots. After gather data, they create a visual representation of their data through the use of a stem and leaf plot. ...
Curated OER
Catches and landed value of fish
Young scholars analyze data. In this secondary mathematics lesson, students read and retrieve data from a statistical table on the Canadian fishing industry. Young scholars interpret and describe data in mathematical terms...
Curated OER
Fossil Fuels and Its Effects On The World
Students explore the effects of a declining fossil fuel system would have on the world. They read the line graph and other information to answer questions about fossil fuels. Students use mathematics to analyze graphical data and...
Curated OER
Are You Thirsty? The Effects of Pollution on Drinking Water
Discuss the availability of clean, plentiful water and the causes of water pollution. In groups, sixth graders discuss problem-solving methods for keeping water clean. They explore the function of water treatment plants and perform...
Pennsylvania Department of Education
Counting Numbers: Four
Students practice counting to four. In this counting to four lesson, students access an e-book at "I Save A Tree.com" where they count items up to four. They examine the text and images which can be seen in both Spanish and English.
Curated OER
Plotting Wind Speed and Altitude
Students construct, read and interpret tables, charts and graphs. They draw inferences and develop convincing arguments that are based on data analysis. They create a graph displaying altitude versus wind speed.


