Curated OER
Graphing Data Brings Understanding
Students collect, graph and analyze data. In this statistics lesson, students use circle, pie, bar and lines to represent data. They analyze the data and make predictions bases on the scatter plots created.
Curated OER
Learning to Read Graphs
In this learning to read graphs worksheet, students look at the graph showing children's favorite colors, then write how many children like each of the 4 colors.
Curated OER
Graph Functions with Integers
Fifth graders can do a quick review of graphing functions using integers with this worksheet. The worksheet has questions which require students to identify the pertinent information in a word problem, and create a graph to represent the...
Curated OER
Savings Planning Using Tables, Line Graphs and Early Proportionality
Students use proportional reasoning to make a chart of daily savings transactions and balances. In this accounting instructional activity, students read word problems and complete three handouts about a bidding and accounting problem....
Curated OER
Reading a Bar Graph
For this reading a bar graph worksheet, students look at the bar graph about favorite colors and write the number that each bar represents.
Curated OER
Graphs Review
Seventh graders review different types of graphs such as bar graphs, line graphs, box & whisker plots. As a class, they read a story and construct graphs to solve the data in the story. Students play "Graph Jeopardy" which requires...
Curated OER
Read a Bar Graph
In this bar graph worksheet, students use a bar graph of favorite zoo animals to solve 6 simple word problems. Houghton Mifflin text is referenced.
Curated OER
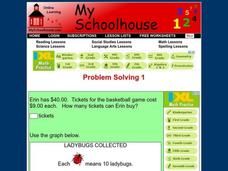
Problem Solving 1
In this online interactive problem solving worksheet, students read a graph and use their problem solving skills in order to respond to 10 questions.
Curated OER
Reading and Making Pie Graphs
In this pie graphs worksheet, learners solve 10 different problems that include reading a pie graph. First, they use the pie graph to respond to 5 questions that follow. Students determine the year that had the smallest and largest...
Curated OER
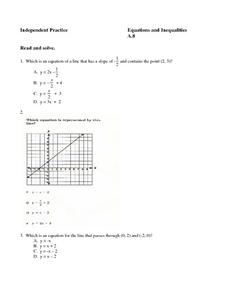
Equations: Graphs, Lines, Slope
In this equations worksheet, students complete 8 multiple choice questions regarding writing equations in slope-intercept and matching an equation to its graph in the coordinate plane.
Curated OER
Interpreting Graphs: Temperate Climates
In this interpreting graphs worksheet, students read a graph containing data of rainfall and temperature, then complete 18 questions, interpreting the data.
Curated OER
Graphs
In this graphs instructional activity, 10th graders identify and solve 10 different problems that include reading various graphs of lines. They determine the equation for each graph whether it is dealing with tangent, cotangent, secant...
Curated OER
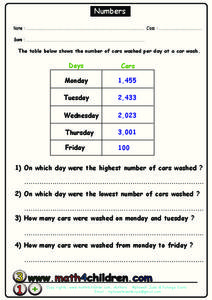
Numbers
In this comparing numbers worksheet, students read the graph that shows the number of cars washed per day at a car wash. Students then compare the numbers by answer the questions.
Curated OER
Get a Leg Up
Traveling through space is an amazing experience, but it definitely takes a toll on the body. After reading an article and watching a brief video, learners perform an experiment that simulates the effects of zero gravity on the...
Curated OER
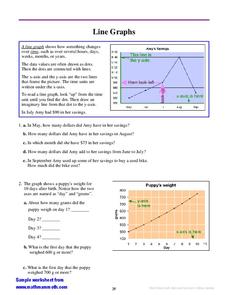
Line Graphs
For this interpreting line graphs worksheet, students read an explanation and observe an example of a line graph and its parts and then answer questions interpreting two line graphs. Students write eleven answers.
Curated OER
Weather, Data, Graphs and Maps
Students collect data on the weather, graph and analyze it. In this algebra instructional activity, students interpret maps and are able to better plan their days based on the weather reading. They make predictions based on the type of...
Curated OER
Math: Skyscraper Comparison
Young scholars examine skyscrapers by conducting Internet research and by creating and interpreting graphs. After reading the book, "Skyscraper," they discuss reasons why the structures are built. Once they have researched the tallest...
Curated OER
Creating a Graph
Students brainstorm favorite things to do during the summer. They survey classmates to collect data, arrange it in a chart, and create graphs using ClarisWorks.
Curated OER
Graphing and the Coordinate Plane
Students examine the four quadrants of Cartesian coordinate plane. They play maze games and coordinate games to discover how to read and plot points on the plane. Students plot points on the coordinate plane and examine the ratio of...
Curated OER
Bunny Cakes and Graphing
Third graders graph and analyze data relating to the book "Bunny Cakes" by Rosemary Wells. They listen to and discuss the book, vote on their favorite cake using Excel computer software, and discuss the results.
Curated OER
Bar Graphs
Students perform operations and graph their data using charts and bar graphs. In this algebra lesson, students follow specific steps to make a bar graph. They create a survey about people favorite things and plot their data from the...
Curated OER
Weather Graph
In this graphing worksheet, students read the average monthly maximum and minimum temperatures in Paris and use them to complete a color coded line graph. Students graph 24 figures.
Curated OER
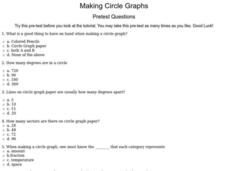
Making Circle Graphs
In this circle graphing worksheet, 6th graders answer ten multiple choice questions based on their knowledge of circle graphs. This is an interactive worksheet.
Curated OER
Interpreting Graphs
In this algebra worksheet, students interpret graphs using given data and information. They are asked to relate real world scenario using algebraic equations. There are 31 questions with a variety of topics being covered.


