PHET
Radiation Hazards in Space
Young scientists race from Earth to Mars and back, trying to complete mission objectives while avoiding radiation in this game for 2-4 players. To identify the winner, players must graph their mission points and radiation points at the...
Curated OER
Understanding Growth of the Phoenix Area
Students study the growth of the Phoenix area using geographic images, maps, tables, and graphs. They study the idea of community.
Teach Engineering
News Flash!
Extra, extra, read all about it! Scholars research information on endangered species and produce a news report to share their findings with the rest of the class. In groups, they then consider engineering solutions to problems on habitat...
Curated OER
Bar Me In
Fourth graders watch a video about constructing bar graphs. They create their own graph and interpret it.
Curated OER
Survey Say...
Students examine a variety of charts and graphs that present data in a format that is easy to read. They work in groups to conduct a survey amongst their classmates. The data collected from the survey is then put on a bar graph.
Curated OER
Introduction to Graphical Representation of Data Sets in Connection to Cellular Growth
Students practice graphing relationships between variables by studying topics such as exponential growth and decay. They conduct a series of numerical experiments using a computer model and a variety of physical experiments using mold,...
Curated OER
Going My Way?
Learners discuss how each one of them leaves school each day. They create and analyze a class graph displaying the information collected.
Curated OER
Raquel's Radishes
Sixth graders develop a reasonable hypothesis for a fictional science fair investigation. 'Raquel' is going to grow radishes and test for the best way to nourish them. They create a bar graph and write conclusions.
Curated OER
Enhancing Writing Through Technology
Students participate in a class survey of their favorite activity to do in the snow and organize the results in a graph. They write a paragraph about the graph using language from a class-developed word web and include both an opening...
Curated OER
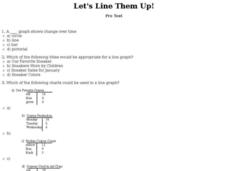
Let's Line Them Up!
In this line graph worksheet, students read through the problems about graphing and line graphs. Students select the best answer to solve the 10 online questions.
Curated OER
E3 Practice Assessment - Pets
In this assessment worksheet, 3rd graders complete eight pages of math assessment. Students solve problems related to money and a bar graph. Students solve word problems involving rounding and computation.
Curated OER
Sweethearts and Data Analysis
Students explore the concept collecting and representing data. In this collecting and representing data lesson, students record the different colors of sweetheart candies in their sweethearts box. Students create a table of the data and...
Curated OER
Apple Eaters
Students sample a variety of apples and graph group results for the class favorites. They orally explain the graph.
Curated OER
'The Flood'
Students hear the story "The Flood," and take a survey of the favorite pet animals in the class. They take the information complied in the survey and make a bar graph to show favorite pet animals using the computer program KidPix.
Curated OER
Waste Audit
Students engage in a lesson that is concerned with the concept of mental math. They perform calculations as following: recognizing a half, three quarters, and tenths. Students are also challenged to extend skills to making calculation...
Curated OER
What You See Is What You Get
Young scholars practice visualization as a strategy for reading and comprehending math word problems.
Curated OER
Parabola (Lab Version)
Students develop definition for parabola, explain relationship between properties of the graph of a parabola and its equation, explain how the equation of a parabola can be written in different forms, and solve problems that relate the...
Curated OER
Using My Nasa Data To Determine Volcanic Activity
Students use NASA satellite data of optical depth as a tool to determine volcanic activity on Reunion Island during 2000-2001. They access the data and utilize Excel to create a graph that has optical depth as a function of time for the...
Curated OER
Points in the Complex Plane -- Lab
Students review the lecture portion of this lesson. Individually, they graph various points on a complex plane and identify conjugates based on their location on the graphs. They complete a worksheet and review their answers to end the...
Curated OER
My Favorite Book Survey
For this my favorite book survey worksheet, students survey their classmates to find out what books they enjoyed reading the most during the year. Students record their choices and keep tally marks on their data.
Curated OER
Parabola with Horizontal Directrix
Young scholars find the vertex, directrix, and focus of a parabola. They graph parabolic functions and solve application problems involving parabalas.
Curated OER
Parabola With Horizontal Directrix
Students find the vertex, directrix, and focus of a parabola and graph parabolic functions. They solve problems involving parabolas after a demonstration lesson plan by the teacher.
Curated OER
Parabola
Students develop a definition of parabola and explain the relationship between the properties of the graph of a parabola and its equation. They explain how the equation of a parabola can be written in different forms and solve problems...
Curated OER
Math: "Scales"
Third graders investigate ratios and rates. In this third grade mathematics lesson plan, 3rd graders identify equal ratios and rate and test for proportionality. This lesson plan is created to be use in conjunctions with a...


