EngageNY
Geometric Interpretations of the Solutions of a Linear System
An intersection is more than just the point where lines intersect; explain this and the meaning of the intersection to your class. The 26th segment in a 33-part series uses graphing to solve systems of equations. Pupils graph linear...
Inside Mathematics
Party
Thirty at the party won't cost any more than twenty-five. The assessment task provides a scenario for the cost of a party where the initial fee covers a given number of guests. The class determines the cost for specific numbers of guests...
EngageNY
Modeling Linear Relationships
Math modeling is made easy with the first installment of a 16-part module that teaches pupils to model real-world situations as linear relationships. They create graphs, tables of values, and equations given verbal descriptions.
EngageNY
Real-World Positive and Negative Numbers and Zero
Class members investigate how positive and negative numbers are useful in the real world. Individuals first read a short passage and identify terms indicating positive and negative numbers. They consider situations involving positive...
Curated OER
Math Review for Grade 2 (2.6)
For this math review for grade 2 (2.6) worksheet, 2nd graders answer 25 multiple choice questions in standardized test format about addition, subtraction and bar graphs.
Curated OER
Graphs to Represent a Data Set
By analyzing a word problem about hours worked in a week, scholars get valuable practice with bar graphs and data analysis. They read the scenario, then examine a table of data taken from it. The data includes four days and the...
Curated OER
Graphs to Represent a Data Set
As your scholars begin to learn how to read graphs, help them pay attention to detail with this matching activity. They read four short data descriptions and match them to one of the four bar graphs pictured. Each graph is labeled along...
Curated OER
Best-Selling Books Bar Graph
Students fill in bar graphs to show ten of the best-selling students' books of all time. Students create simple bar graphs to show how many copies of each of the ten books have been sold.
Curated OER
Drug Sales Soar: Bar Graph
In this graphs worksheet, students analyze a bar graph that shows retail prescription drug sales in the U.S. Students complete five problem solving questions about the data on the graph.
Curated OER
Bar Graph
In this bar graph worksheet, 2nd graders answer short answer questions about how many animals are in each section of the bar graph. Students answer 6 questions.
Curated OER
Bar Graph
In this bar graph worksheet, students answer short answer quesitons about a bar graph titled "Adam and his Toys". Students complete 6 short answer questions.
Curated OER
Using Graphs and Charts
Students complete T charts and manipulate numbers using graphs and charts. In this math graphs and charts lesson, students review the concepts of pattern and function. Students then complete practice pages where they manipulate numbers...
Curated OER
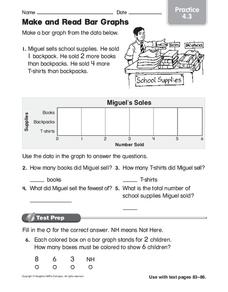
Make and Read Bar Graphs
For this bar graphs worksheet, students make a bar graph about the sale of school supplies with the data presented in one story problem.
California Academy of Science
California's Climate
The United States is a large country with many different climates. Graph and analyze temperature and rainfall data for Sacramento and Washington DC as you teach your class about the characteristics of Mediterranean climates. Discuss the...
Beyond Benign
Municipal Waste Generation
Statistically, waste may become a problem in the future if people do not take action. Using their knowledge of statistics and data representation, pupils take a look at the idea of waste generation. The four-part unit has class members...
Curriculum Corner
8th Grade Math "I Can" Statement Posters
Clarify the Common Core standards for your eighth grade mathematicians with this series of classroom displays. By rewriting each standard as an achievable "I can" statement, these posters give students clear goals to work toward...
Curated OER
Exploring Renewable Energy Through Graphs and Statistics
Ninth graders identify different sources of renewable and nonrenewable energy. In this math lesson, learners calculate their own carbon footprint based on the carbon dioxide they create daily. They use statistics to analyze data on power...
Oklahoma State University
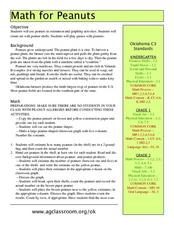
Math for Peanuts
Peanuts! Get your peanuts! Kids explore math, art, and agriculture concepts focused on peanuts. There is a brief informational text to get them started, and you'll find definitions of five in-text vocabulary words to address. Kids...
Curated OER
Yummy Math
Young mathematicians use bags of Skittles to help them gain practice in graphing and organizing data. They work in pairs, and after they have counted and organized their Skittles, they access a computer program which allows them to print...
Curated OER
Graph Mole
Practice graphing ordered pairs by playing an online graphing game. Learners will discover why it is useful to plot coordinates on a xy plane. Graph Mole, is the online game that allows them to practice through a fun, interactive story....
Curated OER
Math Hunt
Go on a scavenger hunt around your school to find evidence of math. Investigate different areas of your school for patterns, fractions, and different geometric shapes. Finally, create a spreadsheet and plot the data you've collected.
Curated OER
Position and Time Graphs
A series of graphs are displayed with points plotted for time and position. A question is asked for each, requiring your class to view one axis and track its partner coordinate. A few examples are given to begin each section, and so this...
Illustrative Mathematics
Favorite Ice Cream Flavor
What better way to engage children in a math lesson than by talking about ice cream? Using a pocket chart or piece of chart paper, the class works together creating a bar graph of the their favorite ice cream flavors. Learners then work...
Institute of Electrical and Electronics Engineers
Coloring Discrete Structures
What's the least number of colors needed to color a U.S. map? The lesson begins by having pupils view a video clip on continuous and discrete phenomenon, then launches into an activity reminiscent of Zeno's paradox. A separate video...


