Curated OER
Applied Science - Science and Math Lab
Students make a prediction. In this applied science lesson, students guess the number of items in a jar. Students create a bar graph to show the predictions and the actual amounts.
Curated OER
Making a Circle Graph of a Sample Budget
Young scholars examine a sample budget and categorize the entries as a group. Then in small groups they convert budget category totals to percents and degrees to make a circle graph related to a sample budget.
Curated OER
Build A Skittles Graph
Students explore graphing. In this graphing lesson, students sort Skittles candies and use the color groups to create a bar graph. Rubrics and extension activities are provided.
Curated OER
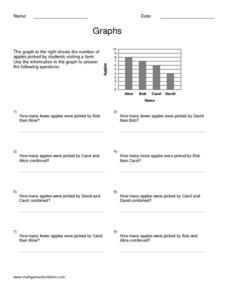
Graphs
In this graphing learning exercise, students read information and study diagrams about graphing. Students complete 3 graphing activities.
Curated OER
Graphs
In this graphing worksheet, 9th graders read one page of graphing examples and complete 8 exercise problems. Each problem involves graphing and coordinates.
Curated OER
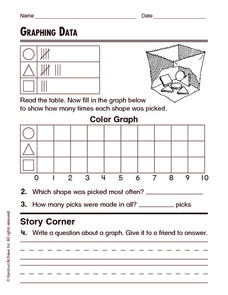
Graphing Data
In this graphing data worksheet, students solve and complete 8 different word problems related to graphing data given. First, they determine the percent of people who do not believe in any of the phenomena described and explain. Then,...
Curated OER
Math Who Am I?
In this math vocabulary worksheet, students read each description of a math term and write the word on the blank line. They circle every third letter in each letter box next to the clue to check their answer. They complete 8 definitions.
Sinclair Community College
Solving Linear Inequalities
Your learners will appreciate the complete picture of linear inequalities presented in this lesson plan. Starting simply with definitions and moving all the way to solving linear inequality word problems this activity is simple to...
Curated OER
Agriculture and the Government
Students study the government's involvement in the U.S. A's food production and make connections relating to farm programs. For this historical agriculture lesson, students read content and research significant information....
Curated OER
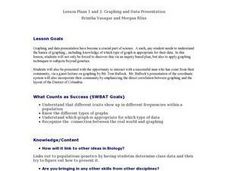
Graphing And Data Presentation
Students engage in a study of science and mathematics with the practice of creating graphs. A guest speaker comes to the class to share statistics from the community and the students are shown how he uses the coordinate system in the...
Illustrative Mathematics
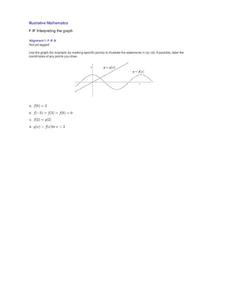
Interpreting the graph
The purpose of this exercise is to give practice in reading information about a function from its graph. Learners are given graphs of two functions on the same axes. The task is to locate and label various key points on the graph that...
Curated OER
Students' Favorite Reading Topics
Students complete surveys about their favorite reading topics to determine the kinds of books to purchase for the school library.
Curated OER
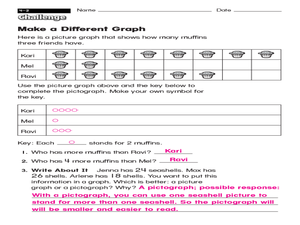
Make a Different Graph
What is the difference between a picture graph and a pictograph? Young learners are given a picture graph detailing how many muffins three friends have, and they must complete a pictograph using a symbol of their choice. An answer key is...
Shodor Education Foundation
Graphing and the Coordinate Plane
Ready to introduce your class to the coordinate plane? This website includes a detailed lesson plan that includes two interactive games to help learners practice graphing ordered pairs. The scripted discussion is a little cheesy and a...
Curated OER
Graphs: All About Our Class
Students respond to survey questions, discuss results, brainstorm ways to represent survey information, and create table of class results. They find mean, range, and percentages, and create graph to display results.
Curated OER
Tim and Pat at the Store: Bar Graphs
Do you like candy? Tim and Pat go to the candy store every day after school. Can you use the chart to determine how much money they spend each day? Does one spend more than the other?
Curated OER
Treasure Hunt: Coordinate Graphing
Two of the best words any one can hear– treasure hunt! Your class will be excited to practice graphing on a coordinate grraph as they identify and write coordinates for landmarks they see on a treasure map. They trace their route to the...
Curated OER
Reading & Using a Nutrition Label
Students discover the importance of healthy eating. Using food nutrition labels, they read and examine the nutritional value. Students collect the data on a spreadsheet and create a graph. They analyze the media influences on product...
Curated OER
The Math Of African Music
Students practice rhythms and fractions on African drums in this Music lesson plan mixing Math skills and music notation. The lesson plan also includes ideas for assessment and state and national benchmarks met.
Curated OER
Reading a Graph: Azimuth Range vs. Day in Barrow Alaska
Learners practice reading a graph while doing story problems. They determine the x and y intercepts and calculate the slope. They also practice writing linear equations.
Math Mammoth
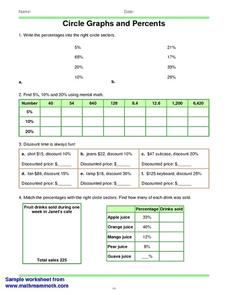
Circles Graphs and Percents
In this percent instructional activity, students read and interpret circle graphs. They determine discounts, and match percentages with circle sectors. This one-page instructional activity contains approximately 30 problems.
Charleston School District
Sketching a Piecewise Function
How do you combine linear and nonlinear functions? You piece them together! The lesson begins by analyzing given linear piecewise functions and then introduces nonlinear parts. Then the process is reversed to create graphs from given...
Inside Mathematics
Population
Population density, it is not all that it is plotted to be. Pupils analyze a scatter plot of population versus area for some of the states in the US. The class members respond to eight questions about the graph, specific points and...
Inside Mathematics
Scatter Diagram
It is positive that how one performs on the first test relates to their performance on the second test. The three-question assessment has class members read and analyze a scatter plot of test scores. They must determine whether...


