EngageNY
Comparing Estimated Probabilities to Probabilities Predicted by a Model
Small groups devise a plan to find the bag that contains the larger percentage of blue chips. they then institute their plans and compare results to the actual quantities in the bags.
Inside Mathematics
Scatter Diagram
It is positive that how one performs on the first test relates to their performance on the second test. The three-question assessment has class members read and analyze a scatter plot of test scores. They must determine whether...
Mathed Up!
Stratified Sampling
Young mathematicians learn how to solve problems involving stratified sampling. They review concepts of sampling and proportionality by watching a video and then they complete a worksheet of questions on this topic.
Curated OER
2007 U.S. National Chemistry Olympiad Part II
Eight multi-step chemistry problems, including analyzing a titration, writing equations, predicting products and limiting reagents, calculating concentrations of ions, and using stoichiometry to solve for unknowns in reactions make up...
Inside Mathematics
Rhombuses
Just what does it take to show two rhombuses are similar? The assessment task asks pupils to develop an argument to show that given quadrilaterals are rhombuses. Class members also use their knowledge of similar triangles to show two...
EngageNY
The Relationship of Multiplication and Division
Take any number, multiply it by five, and then divide by five. Did you end up with the original number? In the same vein as the previous lesson, pupils discover the relationship between multiplication and division. They develop the...
EngageNY
Writing and Evaluating Expressions—Exponents
Bring your young mathematicians into the fold. Scholars conduct an activity folding paper to see the relationship between the number of folds and the number of resulting layers in the 23rd installment of a 36-part module. The results of...
Inside Mathematics
Archery
Put the better archer in a box. The performance task has pupils compare the performance of two archers using box-and-whisker plots. The resource includes sample responses that are useful in comparing individuals' work to others.
Noyce Foundation
Ducklings
The class gets their mean and median all in a row with an assessment task that uses a population of ducklings to work with data displays and measures of central tendency. Pupils create a frequency chart and calculate the mean and median....
Other
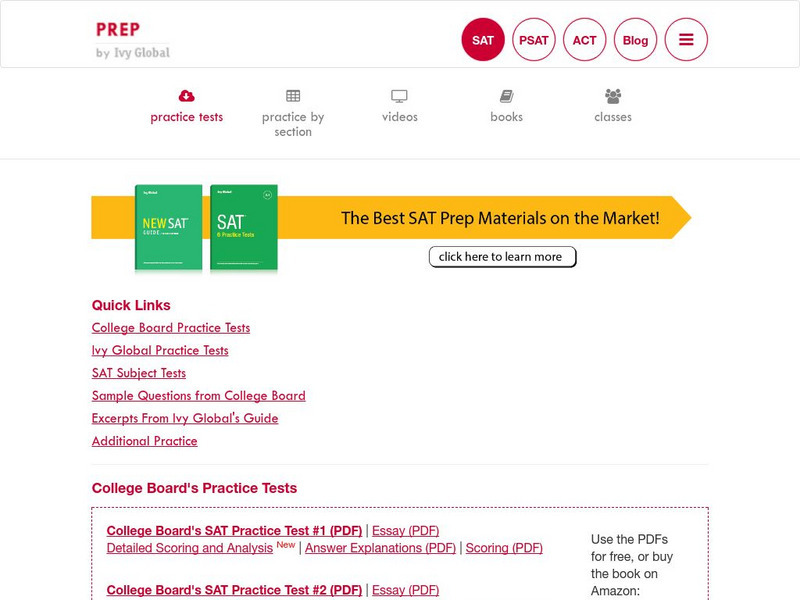
Ivy Global: Sat Practice Tests
Students can access SAT's practice tests here, as well as take some diagnostic tests to find their weak areas and to predict their probably results on the SAT. In addition, this site offers insights into the make-up of the new SAT, and...


