Curated OER
Solar Storms: Odds, Fractions and Percentages
In this solar storms worksheet, students read about the correlation between different astronomical events to find patters and new 'laws' of nature. Students use given statistical information about solar flares and coronal mass ejections...
EngageNY
The Relationship of Multiplication and Division
Take any number, multiply it by five, and then divide by five. Did you end up with the original number? In the same vein as the previous instructional activity, pupils discover the relationship between multiplication and division. They...
Curated OER
An Introduction to Space Radiation
In this space radiation worksheet, students read about the various types of radiation humans are exposed to. Students answer 5 questions based on the reading. They calculate the amount of energy gained when exposed to a certain amount of...
Curated OER
Spotting an Approaching Asteroid or Comet
In this asteroid and comet worksheet, students read about the formula used to determine the brightness of asteroid. They apply this formula to solve 2 problems about asteroids and their brightness.
Curated OER
Black Hole...Fade-out!
In this black hole worksheet, high schoolers read about how images fade to black when they reach an event horizon of a black hole. Students solve 3 problems about black holes using a given equation for luminosity. They find the time it...
Curated OER
Problem Solving: Use a Number Line
In this number line worksheet, students use a number line to solve six problems about temperature change. They explain why their answers make sense.
Curated OER
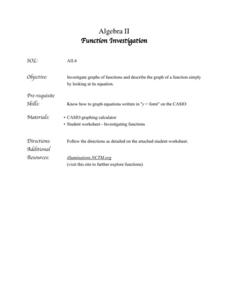
Function Investigation
In this functions activity, 11th graders solve and complete 18 different problems. First, they graph each equation on the graphs provided, making a rough sketch on a coordinate plane. Then, students predict what each graph will look like...
Curated OER
Analyze a Survey
In this analyzing data worksheet, students read a tally chart regarding survey information and respond to 4 analytical questions regarding the data.
Curated OER
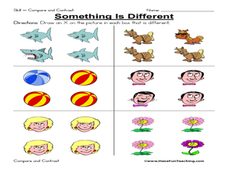
Something is Different: Same/Different
In this different/same worksheet, student draw an X on the picture in a box that is different from the others, 6 sets total. A reference web site is given for additional activities.
EngageNY
Writing and Evaluating Expressions—Exponents
Bring your young mathematicians into the fold. Scholars conduct an activity folding paper to see the relationship between the number of folds and the number of resulting layers in the 23rd installment of a 36-part module. The results of...
Noyce Foundation
Ducklings
The class gets their mean and median all in a row with an assessment task that uses a population of ducklings to work with data displays and measures of central tendency. Pupils create a frequency chart and calculate the mean and median....
Inside Mathematics
Archery
Put the better archer in a box. The performance task has pupils compare the performance of two archers using box-and-whisker plots. The resource includes sample responses that are useful in comparing individuals' work to others.
Inside Mathematics
Rhombuses
Just what does it take to show two rhombuses are similar? The assessment task asks pupils to develop an argument to show that given quadrilaterals are rhombuses. Class members also use their knowledge of similar triangles to show two...
National Council of Teachers of Mathematics
Is It Fair?
In this probability instructional activity, learners answer nine questions about the fairness of games. Students determine if a game is fair or not. They list outcomes and find ones' chances of winning.
California Academy of Science
California's Climate
The United States is a large country with many different climates. Graph and analyze temperature and rainfall data for Sacramento and Washington DC as you teach your class about the characteristics of Mediterranean climates. Discuss the...
Curated OER
Seized Before Flights: Graph
In this bar graph worksheet, students analyze a graph that show the number of prohibited items intercepted at U.S. airport screening checkpoints. Students answer 3 problem solving questions about the data on the graph.
Curated OER
Sky High Fuel
For this fuel price worksheet, students examine a chart that shows fuel prices between 2001 and 2005. They compute the answers to 3 word problems in which they work with finding average. They complete an extension activity in which they...
Curated OER
U.S. Beach Attendance
In this bar graphs worksheet, learners analyze the information about beach attendance over a period of 5 years. Students solve 3 story problems about the graph.
Other popular searches
- Making Predictions Reading
- Predictions in Reading
- Making Predictions in Reading
- Reading Prediction Strategy
- Predictions Before Reading
- Reading Prediction Outcome
- Reading Prediction Skills
- Making Prediction in Reading
- Guided Reading Predictions
- Predictions Reading
- Prediction in Reading
- Prediction Reading


