Curated OER
Graph Functions with Integers
Fifth graders can do a quick review of graphing functions using integers with this worksheet. The worksheet has questions which require students to identify the pertinent information in a word problem, and create a graph to represent the...
Curated OER
Get the Picture with Graphs
Fifth graders examine line, bar and circle graphs in the newspaper and on the Internet. They complete sketches of graphs with an emphasis on selecting the best model to depict the data collected.
Curated OER
Canadian Social Trends
Young scholars use surveys to explore how to design graphs, tables, and diagrams. They discuss articles which can stimulate ideas for research topics, or surveys of their own.
Noyce Foundation
Ducklings
The class gets their mean and median all in a row with an assessment task that uses a population of ducklings to work with data displays and measures of central tendency. Pupils create a frequency chart and calculate the mean and median....
EngageNY
Modeling Linear Relationships
Math modeling is made easy with the first installment of a 16-part module that teaches pupils to model real-world situations as linear relationships. They create graphs, tables of values, and equations given verbal descriptions.
Concord Consortium
Betweenness II
Read between the curves ... quadratic curves! Young scholars analyze the graphs of two quadratic functions by writing their own function whose outputs are between the two given. They then consider intersecting quadratic functions and...
Curated OER
Creating Graphs from Tables
Students interpret data from tables and then create a graph to show the same data in a different organization.
Curated OER
Reading Graphs
Students practice plotting functions on the Cartesian coordinate plane, see several categories of functions, including lines and parabolas, and read a graph, answering questions about the situation described by the graph
Curated OER
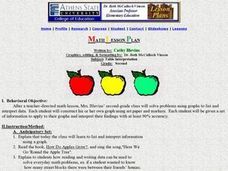
Table Interpretation
Students solve problems using graphs to list and interpret data. Each student construct his or her own graph using art paper and markers. They be given a set of information to apply to their graphs and interpret their findings.
Curated OER
An Immigration Graph
Students practice reading and understanding information in a table and converting the information to graph form. They create a graph showing the number of immigrants per country of origin between 1899 and 1924.
Curated OER
Table Readings
In this table instructional activity, students read questions and interpret tables. Questions include information concerning unemployment, oil imports, and foreign students. This multiple-choice instructional activity contains 10...
Curated OER
Using A Table
In this table activity, students observe information in a table, and then answer ten questions pertaining to the information. They must correctly read a table in order to arrive at the correct answer. Questions pertain to features of a...
Curated OER
Using Graphs and Charts
Students complete T charts and manipulate numbers using graphs and charts. For this math graphs and charts lesson, students review the concepts of pattern and function. Students then complete practice pages where they manipulate numbers...
Curated OER
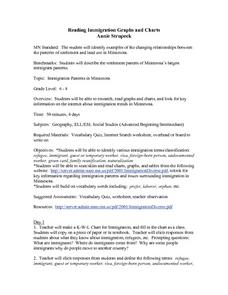
Reading Immigration Graphs and Charts
Students examine the settlement patterns and land use in Minnesota. In groups, they practice reading immigration graphs and charts and discuss why immigrants settled where they did. They are also introduced to new vocabulary related to...
Curated OER
Problem-Solving Application: Use a Graph: Problem Solving
In this graph usage worksheet, learners read the word problem and then learn to use a math graph by following the steps of understand, plan, solve, and look back.
Curated OER
Making A Horizontal Bar Graph
In this bar graph worksheet, students create a bar graph to display 6 scores from basketball games. Students will label the x and y axis and correctly plot the scores from the table provided.
Curated OER
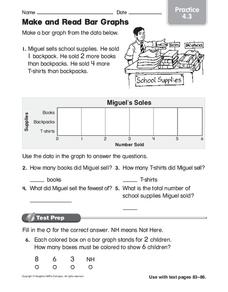
Make and Read Bar Graphs
In this bar graphs worksheet, students make a bar graph about the sale of school supplies with the data presented in one story problem.
Curated OER
Deciding Which Type of Graph is Appropriate
For this graphing worksheet, learners read about line, bar, and pie graphs and then determine which graph is the best way to express data results. This worksheet has 3 short answer questions.
Curated OER
Seized Before Flights: Graph
In this bar graph worksheet, students analyze a graph that show the number of prohibited items intercepted at U.S. airport screening checkpoints. Students answer 3 problem solving questions about the data on the graph.
Curated OER
Bar Graph- Calories In Fast Food Items
In this bar graph worksheet, students analyze a bar graph that shows calories in 10 fast food menu items. Students answer 7 questions about the graph.
Curated OER
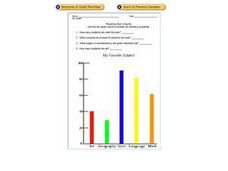
Reading Bar Graphs: My Favorite Subject
In this bar graphs worksheet, students analyze a bar graph about favorite school subjects. Students use the information on the graph to answer 7 questions.
Curated OER
Canada Recycles! Do You?: Grades 4-6
In this recycling education worksheet, students read a table regarding Canadian recycling statistics and respond to 9 questions regarding the data.
Curated OER
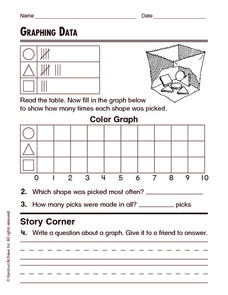
Read the Table Graph
In this reading the table graph worksheet, learners read the graph and answer questions. In this short answer worksheet, students write answers to four questions.
Curated OER
Graphing Data
In this graphing data worksheet, students solve and complete 8 different word problems related to graphing data given. First, they determine the percent of people who do not believe in any of the phenomena described and explain. Then,...


