Better Lesson
Better Lesson: Dr. Seuss Graphs Part 1
Favorite Dr. Seuss characters are something that students can collect data on, graph and interpret.
National Council of Teachers of Mathematics
The Math Forum: Growth Creature Lab Data Collecting
Lesson plan completely explains how students will collect data on the growth of an "alligator" and determine the relationship of the growth data to the Fundamental Theorem of Similarity and to topics in geometry in general. All of the...
TeachEngineering
Teach Engineering: Graphing Your Social Network
Students analyze their social networks using graph theory. They gather data on their own social relationships, either from Facebook interactions or the interactions they have throughout the course of a day, recording it in Microsoft...
TeachEngineering
Teach Engineering: Using Graph Theory to Analyze Drama
Students analyze dramatic works using graph theory. They gather data, record it in Microsoft Excel and use Cytoscape (a free, downloadable application) to generate graphs that visually illustrate the key characters (nodes) and...
Oswego City School District
Regents Exam Prep Center: Categorizing Data
Three lessons on different types of data (qualitative, quantitative, univariate, bivariate, biased data) as well as a practice activity and teacher resource.
University of Waterloo (Canada)
Wired Math: Organizing Data Grade 7 [Pdf]
A collection of worksheets that focus on data analysis and organizing data. Includes detailed examples, colorful visuals, and a link to a related game. Acrobat Reader required.
National Center for Ecological Analysis and Synthesis, University of California Santa Barbara
Kids Do Ecology: Data and Science
Learn about conducting your own investigation with these tips on following the scientific method. Find out how to state hypothesis, make observations, collect and analyze data, and display data to share results and conclusions of your...
TeachEngineering
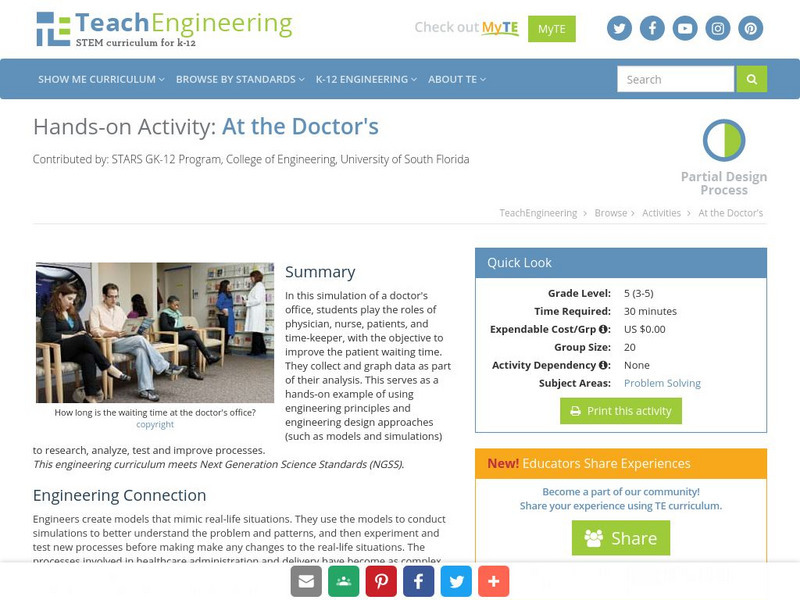
Teach Engineering: At the Doctor's
In this simulation of a doctor's office, students play the roles of physician, nurse, patients, and time-keeper, with the objective to improve the patient waiting time. They collect and graph data as part of their analysis. This serves...
National Council of Teachers of Mathematics
Nctm: Figure This: Census
Try this real world challenge that focuses on data collection, data analysis, and problem solving with information from the U.S. Census Bureau. Discover how these skills are applied in real life situations in this one page activity from...
PBS
Pbs Mathline Lesson Plan: Struts'n Stuff [Pdf]
Incorporating concepts in algebra, number sense, patterning, data collection, and geometry, this lesson engages students in various hands-on activities to explore the relationship between regular polygons and the number of diagonals...
TeachEngineering
Teach Engineering: Graphing the Spread of Disease
Students simulate disease transmission by collecting data based on their proximity to other students. One option for measuring proximity is by having Bluetooth devices "discover" each other. After data is collected, students apply graph...
Center for Innovation in Engineering and Science Education, Stevens Institute of Technology
Ciese Collaborative Projects: International Boiling Point Project
An Internet project designed to determine the greatest influence on the boiling point. After reading the project instructions and performing the experiment, submit your data and compare your results to other classes from around the world.
Texas Instruments
Texas Instruments: A Wet Welcome Home Adventure 4
Students perform an experiment that simulates a leaking pipe and gather data on volume of water lost over time. They graph the data collected as a scatter plot, find the equation of the line of best fit, find the total volume of water...
US Department of Education
Nces Kids: Creating an Area Graph
This is where you will find step by step directions explaining how to create an area graph. Complete each step and click on the next tab. Directions are simple and clear.
PBS
Pbs Mathline: Button, Button Lesson Plan [Pdf]
An integrated math and language arts instructional activity focusing on statistics. Students explore the concepts of estimation, data collection, data analysis, classification, graphing, and counting through the reading of the Button Box...
Alabama Learning Exchange
Alex: Getting to Know Your Classmates Using Bar Graphs
Students will collect data from class using surveys. Students survey classmates concerning favorite movies, favorite color, shoe size, time spent studying, brand of cell phone and etc. From the data they will create bar graphs using an...
PBS
Pbs Lesson Plan: Chances Are Talking Probability (Pdf) [Pdf]
An introductory lesson in probability for learners in grades three to five. The concepts presented in this lesson are interwoven, over time, into a current unit of study. Students examine closely the "language" of probability as used in...
Science Education Resource Center at Carleton College
Serc: Mn Step: Statistical Analysis of Lincoln
For this activity, students first work in groups to collect information about a set of pennies. They measure and record the mass for each one in a table using a spreadsheet program if possible. They also record its year and, for 1982...
Texas Instruments
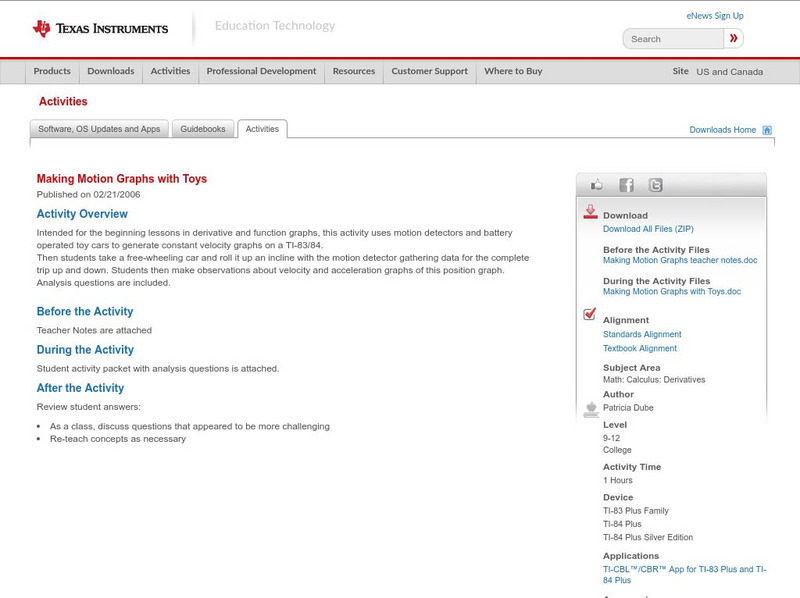
Texas Instruments: Making Motion Graphs With Toys
Intended for the beginning lessons in derivative and function graphs, this activity uses motion detectors and battery operated toy cars to generate constant velocity graphs on a TI-83/84. Then students take a free-wheeling car and roll...
Science Education Resource Center at Carleton College
Serc: Exploring Distributions and Graphs Using Cooperative Learning
Using cooperative learning methods, this lesson introduces distributions for univariate data, emphasizing how distributions help us visualize central tendencies and variability. Students collect real data on head circumference and hand...
CK-12 Foundation
Ck 12: Analyzing Data
[Free Registration/Login may be required to access all resource tools.] Students will learn how to choose a type of data visualization based on the kind of data they have collected and the objective of their research.
Science Education Resource Center at Carleton College
Serc: Investigating Motion Graphing Speed
In this introduction to motion activity, students will get a personal understanding of speed and acceleration by experiencing it firsthand. Wheeled office chairs or other cart like devices are used to give one student a ride as a fellow...
Houghton Mifflin Harcourt
Houghton Mifflin Harcourt: Saxon Activity Center: Graphing Calculator Activity: Average [Pdf]
A concise graphing calculator lesson on calculating average. Detailed examples, demonstrations of calculator functions, and practice problems included. Acrobat Reader required.
Texas Instruments
Texas Instruments: Pass the Ball
In this activity, students use mathematics to examine patterns that occur in a specific scenario and predict future events for the scenario. Data is collected on the time it takes to pass a ball. The students plot graphs, fit the data...


