EngageNY
Modeling a Context from Data (part 2)
Forgive me, I regress. Building upon previous modeling activities, the class examines models using the regression function on a graphing calculator. They use the modeling process to interpret the context and to make predictions...
Curated OER
Practice Problems: Correlation and Linear Regression
In this correlation and linear regression activity, learners examine data to determine the statistic mean. They compute the percent of the variability. This three-page activity contains 16 problems. Answers provided.
Flipped Math
Correlation
Determine how close the line is to the scatter plot. Clear video instruction shows how to plot a scatter plot and find the best fit line using the linear regression function on a calculator. Pupils use the information from the calculator...
Curated OER
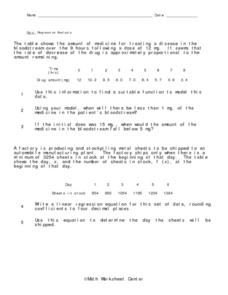
Regression Analysis
In this regression analysis learning exercise, 9th graders solve 10 different word problems related to regression analysis. First, they use the information given to find a suitable function to model the data. Then, students use the model...
Statistics Education Web
NFL Quarterback Salaries
Use statistics to decide if NFL quarterbacks earn their salaries! Learners study correlation coefficients after using technology to calculate regression equations. Through the data, they learn the meaning of correlation and correlation...
Statistics Education Web
The United States of Obesity
Mississippi has both the highest obesity and poverty rate in the US. Does the rest of the data show a correlation between the poverty and obesity rate in a state? Learners tackle this question as they practice their skills of regression....
Statistics Education Web
Text Messaging is Time Consuming! What Gives?
The more you text, the less you study. Have classes test this hypothesis or another question related to text messages. Using real data, learners use technology to create a scatter plot and calculate a regression line. They create a dot...
Flipped Math
Unit 5 Review: Bivariate Data
The data says it's a wrap. Pupils work through four review questions with multiple parts dealing with bivariate data. Questions cover creating and interpreting two-way tables and scatter plots with lines of best fit. Scholars finish up...
Curated OER
Heterogeneous Equilibrium: Measurement of a Partition Coefficient
In this chemistry worksheet, students examine a concept in science and then use the knowledge in application by conducting an experiment.
Curated OER
Correlation and Regression
In this statistics workshop students find the value of linear correlation coefficients in three situations. Students find equations of the regression lines for 4 problems.
Curated OER
Lesson 6-7: Scatter Plots and Equations of Lines
In this scatter plot worksheet, students examine tables and write a linear equation that matches the table. Students graph linear equations. They read scatter plots, determine the trend line, and write a linear equation to...
Curated OER
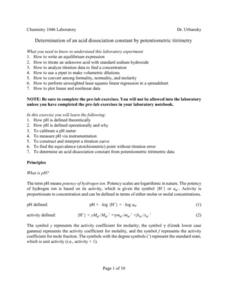
Determination of An Acid Dissociation
In this chemistry worksheet, students examine the given concept in order to apply in the laboratory setting. The sheet includes in depth background information.
Curated OER
Determination of the solubility product of silver(I) chloride
In this chemistry worksheet, students examine the concept of solubility of silver chloride. The sheet has in depth concept and laboratory instructions.
Houston Area Calculus Teachers
Area and Volume
An AP calculus lesson begins with an activity to determine the volume of a solid using a cross-section. Next, learners review the ways to find the area between two curves , as well how to find the volume of a solid created...


