Curated OER
Units of Measurement
Challenge your second graders with a learning exercise on units of measurement! Not only do they put their measurement skills to the test, but kids practice word problem strategies as well. The second part of the resource prompts...
Curated OER
Modeling Linear Relationships
Students graph lines using the slope and y-intercept. In this algebra lesson, students create data using tables and equations. They use their data to make predictions and draw conclusion.
Florida Center for Instructional Technology
Integrating Mathematics into Literature
You class will read Cucumber Soup by Vickie Leigh Krudwig as an anticipatory set for this lesson on ratios. They make models of the insects in the story and then use them as a source of data for this ratio and proportion lesson. This...
Curated OER
The Air Up There
Students observe the weather over a period of two weeks. They gather local weather data and calculate the mean and average figures from the data. They prepare a graph with their observations.
Curated OER
Writing Chemical Formulas
Learners study how to write chemical fomulas by reviewing the combinations atoms form into compounds. They write a procedure to test various substances and name the compounds and write formulas. As they construct models for formulas and...
Curated OER
Mmm, Mmm, M&M's
Here is another version of the classic M&M math lesson. In this one, upper graders utilize the ClarisWorks Spreadsheet program in order to document the data they come up with from their bags of M&M's. After making their initial...
Curated OER
Investigation - Looking For Triangles
Seventh graders investigate a series of triangles, looking for patterns and generalizing what they have found. They analyze the pattern data and organize it into a table and graph. Students identify the relationship and discover the rule...
Virginia Department of Education
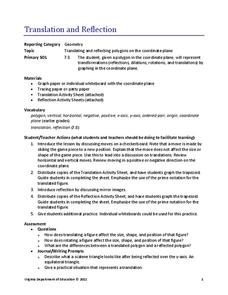
Translation and Reflection
Bring about the change you want to see in the world or at least in your lesson plans. Young mathematicians learn about translation and reflections by applying them to polygons on the coordinate plane. Results provide data to...
Curated OER
Election Poll, Variation 2
When a random sample isn't enough, your math class can compare the data from a physical simulation to decide if the probability is still likely. The lesson is part of a probability series that focuses on one question and different ways...
Foundation for Water & Energy Education
How is Flowing Water an Energy Source? Activity A
Here is a fun little exploration of the potential energy potential of falling water. Learners drop water from various heights using a straw, and they analyze the diameter of the splash. Pair this with two more activities of the same...
Foundation for Water & Energy Education
How is Flowing Water an Energy Source? Activity B
Explore the world's water without leaving the classroom! In this second of three uncomplicated but wonderful activities, physical science learners feel the pressure of water. They discover that the deeper the water, the stronger the...
Curated OER
Scaling it Down: Caves Have Maps, Too
Measurement and map skills are the focus of this lesson, where students crawl through a "cave" made out of boxes, desks and chairs, observing the dimensions. Your young geographers measure various aspects of the cave and practice...
Curated OER
How Much Data is That?
Pupils differentiate between exponential and logarithmic functions. In this algebra lesson, students use logarithmic properties to solve equations. They identify growth and decay of graphs.
Curated OER
Recording Frequency
First graders analyze nursery rhymes and gather data about word frequency. For this frequency lesson, 1st graders create graphs and tables. Students interpret the data.
Curated OER
Statistics with State Names
Students analyze the number of times each letter in the alphabet is used in the names of the states. For this statistics lesson, students create a stem and leaf plot, box and whisker plot and a histogram to analyze their data.
Curated OER
Evolution Lab
Students examine the pattern of natural variation in a society. They examine Darwin's theory of evolution and analyze data. They use computer programs to graphically display the variation in organisms.
Curated OER
Bar Graphs
Third graders investigate bar graphs. In this third grade mathematics lesson, 3rd graders collect and analyze data and use the internet’s Graph challenge to create their own graphs. Students write questions for the other...
Curated OER
A Taste of Our Classroom
Students explore their classroom tastes. In this lesson plan, students list the four tastes that the tongue can detect, map the individual areas of taste on the tongue, and demonstrate the ability to identify objects through the use of...
Curated OER
Billions of Bubbles
Students conduct an experiment with bubbles. In this observation and comparison lesson, students read Bubbles, Bubbles, Everywhere and conduct an experiment where they test different kinds of liquids to see which is the best for a...
Beyond Benign
Water Bottle Unit
How much plastic do manufacturers use to create water bottles each year? The class explores the number of water bottles used throughout the years to determine how many consumers will use in the future. Class members compare different...
EngageNY
Describing a Distribution Displayed in a Histogram
The shape of the histogram is also relative. Learners calculate relative frequencies from frequency tables and create relative frequency histograms. The scholars compare the histograms made from frequencies to those made from relative...
EngageNY
Mid-Module Assessment Task - Algebra 1 (module 2)
A mid-module assessment uses two multi-part questions to measure progress toward mastery on descriptive statistics standards. Each part of a question addresses a single standard to help determine mastery.
Bowland
Soft Drinks
"Statistics are no substitute for judgment" - Henry Clay. Young mathematicians use provided statistics from a soda taste test to explain why conclusions are faulty. They devise a new test that would be more appropriate than the one given.
Cornell University
Sound Off!
Time to witness the effects of sound. Learners analyze different materials to determine their abilities to absorb sound waves. They use free software to monitor the amplitude of the waves to verify results.


