Mathematics Assessment Project
Representing Probabilities: Medical Testing
Test probability concepts with an activity that asks pupils to first complete a task investigating false positive in medical testing and then to evaluate sample responses to the same task.
Classroom Law Project
What does the Constitution say about voting? Constitutional Amendments and the Electoral College
As part of a study of voting rights in the US, class members examine Constitutional amendments connected with voting and the role of the Electoral College in the election process.
Curated OER
Statistics: Standard Deviation and Outliers
In this statistics worksheet, statisticians construct a stem-plot and answer questions regarding the shape of the distribution, standard deviation, and outliers.
Curated OER
Back In The "Old Days"
Fifth graders collect data during their worker interviews while in groups to compile job changes. They analyze the data to determine the categories of changes, patterns/trends of change and future projections. Each group then develops a...
Curated OER
Atomic Candy
Mmmmm! Radioactive "candium!" Nuclear physics or chemistry classes use M&M'S® to demonstrate the process of radioactive decay. Individuals pour out a bag of candies and record the number that fall M-side-up to represent the...
Curated OER
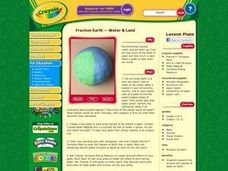
Fraction Earth -- Water and Land
Students research the amount and sources of water on Earth. They interpret data to create a physical representation of water and land mass on the planet. They then use art materials to create a visual and tactile representation of...
Curated OER
Means of Growth
High schoolers collect and graph data. In this statistics instructional activity, students analyze their plotted data using a scatter plot. They identify lines as having positive, negative or no correlation.
Curated OER
Count on Math
Students develop number sense up to a million. In this developing number sense up to a million lesson, students count their breaths in given time span. Students use blocks representing 10's and 100's to create a...
Curated OER
Investing
Young scholars collect data on investments and draw conclusions. In this algebra lesson plan, students analyze exponential graphs as they relate to money. They discuss the cause of an account balance being high or low.
Curated OER
Analyzing Health
Third graders analyze their health. In this analysis lesson plan, 3rd graders rate their health on a 1-10 scale. They then tally the scores from the class and create a data chart. Then they answer true and false questions based on...
Curated OER
Birth and Death Rates in European countries
Students discover the world as a global community and the social implications. They construct graphs to represent data, interpret diagrams and draw inferences.Students create a report, which could lead to a class discussion.
Curated OER
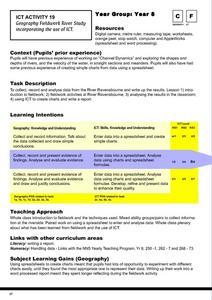
Geography Fieldwork River Study
Eighth graders collect, record, and analyze data from a local river and input the data into the computer. They collect and record the information, discuss the data collected, and enter the data into a spreadsheet and charts to compare...
Curated OER
Scientific Theories
Ninth graders compare and contrast how different models can be used to represent scientific understandings. They evaluate the use of data when considering scientific claims. Students debate a variety of socio-scientific issues and the...
Curated OER
Basketball And Mathematics
Eighth graders collect and analyze data about foul shots taken at basketball games.
National Security Agency
Are You Ready to Call the Guinness Book of Records?
Learners design questions that can be answered by collecting data. In this line-plot activity, pupils collect data and graph on a line plot on world records. An abundant supply of teacher support is provided in this resource.
Curated OER
Graphing and Analysis of Water Quality Reports
Young scholars practice making graphs and interpreting them. They compare and contrast different sets of data. They use Microsoft Excel to create different types of graphs.
Curated OER
Speed + Graphing = Winners!
Fifth graders take addition timed tests every day for a two week period. Using the data from the timed tests, they create a bar graph using Microsoft Excel computer software, a personal bar graph using graph paper and colored pencils,...
Curated OER
Graphing Words Word Search
In this data vocabulary activity, students search for 16 graph-related words in a word search grid. Each word relates to graphing and collecting data.
Alabama Learning Exchange
Inch by Inch
Third graders listen to a read-aloud of Leo Lionni's, Inch by Inch before measuring a variety of items using both standard and metric units. They record the measurement data and follow a recipe for dirt pie.
Curated OER
Mapping the Census
Students learn why the census makes a difference. In this U.S. Census lesson plan, students learn the key elements of cartography, examine the difference between data and their representation, and create a map using census data.
Curated OER
Math Lesson: What Do You Want to Know? - Country Statistics
Learners are able to identify the characteristics of a variety of graphs (i.e. bar graph, line graph, pie graph, scatter plot, population pyramids, etc.) They recognize how the type of data to be presented plays a role in choosing the...
Curated OER
Michigan Virtual Field Trip
Students analyze data from a virtual field trip to Michigan. They conduct Internet research on mileage and travel time between cities, calculate and compare fuel costs, and research and calculate lodging, activities, and meal costs.
Curated OER
Predator-Prey Simulation
In this predator-prey worksheet, students simulate the relationship between predators and prey using small squares to represent rabbits and large squares to represent coyotes. They complete 20 rounds of the simulation trying to get the...
Curated OER
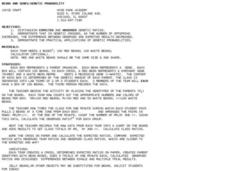
Beans and Genes/Genetic Probability
Students use 2 sets of colored beans to represent the genes of an organism. In this genetic probability lesson plan, students use the colored beans to represent the genotypes of offspring which they pull out of a box at random while the...


