Colorado State University
Does Air Weigh Anything?
Can you feel the weight of the air on your shoulders? Your classes may not believe that air has weight. A straightforward experiment asks individuals to weigh a bottle before and after adding air. Their results may surprise them!
NASA
The Invisible Sun: How Hot Is It?
It's getting hot in here! The first in a series of six lessons has learners model nuclear fusion with a simple lab investigation. Groups collect data and analyze results, comparing their models to the actual process along the way.
National Nanotechnology Infrastructure Network
Small Scale Stenciling: Mask Lab
Investigate the procedure for developing computer chips! Learners use solar print paper to create both positive and negative images. They observe the effects of single and multiple exposures and compare results.
Alabama Wildlife Federation
Leaf Chromatography
Pigmentation of leaves is important in plant processes. Scholars use chromatography to create a better picture of the pigmentation in an assortment of leaves. They share their results to make comparisons between different plant species.
American Museum of Natural History
Trip Up Your Brain
Sometimes different parts of the brain disagree. See what this disagreement looks like using a remote learning resource to experience how brains often take shortcuts. Pupils complete the activity, observe their results, and then read...
Las Cumbres Observatory
Down2Earth: Making Impact Craters
Is the sky falling? Learners use a simulator to modify the mass and velocity of asteroids and collect data on how they influence the diameter and depth of the impact crater. They use their results to draw conclusions and make predictions...
Curated OER
Graphing Glucose Tolerance Test Results.
Students graph glucose test results to compare between people with and without diabetes. In this investigative instructional activity students participate in activities that allow them to better understand diabetes and how to graph...
Curated OER
Results and Conclusions
Fourth graders practice using the scientific method. In this results and conclusions lesson, 4th graders review data collected, create a graph of their data and make their final conclusions about the information collected.
Curated OER
Lab Tests, Results, and Sulfuric Acid
You may want to change the title of this chemistry PowerPoint to "Identifying Compounds in the Laboratory." Individual slides explain tests that can be performed to confirm what element you have: carbon dioxide, carbonates, and metal...
Curated OER
Vectors
Young scholars describe motion by the use of adding vectors to obtain the resultant vector. They comprehend the meaning of a resultant vector. Students identify the difference between the x and y components of vector quantities. Young...
Curated OER
Trends Forecasting
Students practice trends forecasting to predict the weather. In this forecasting lesson plan, students learn how meteorologists predict the weather by looking at weather trends. They then predict their own forecast, analyze the results,...
Curated OER
Wind
Students make a wind vane, anemometer, wind spiral, and wind streamer to calculate wind movement. In this wind lesson plan, students test each of their wind instruments, and graph the results of the wind speed in different locations.
Curated OER
Understanding Oceans
Students investigate how ocean currents affect our world. In this ocean currents lesson, students perform an experiment to show how cold water is near the poles and warm water is near the equator. Students use water, food coloring, ice...
Curated OER
Graphing Pendulum Results
Sixth graders set up a pendulum experiment deciding which variable to manipulate (length of string or weight on the string). They create a hypothesis, collect necessary equipment, and write out each step of their experiment. They then...
Curated OER
Titration Results Sheet
There are two identical half-sheets on this page, each including a data table to indicate the outcome of a titration experiment. Chemistry technicians fill in the reagents used, the final and initial volumes of the titration, and the...
Curated OER
Examine Methods of Reporting Research Results
Students analyze a research report and the list of components needed in a research report and then identify those components based on a set of standards using the scientific method. They collect data which can be used for a graphical...
Curated OER
A Solubility Curve for Potassium Nitrate
Step-by-step laboratory instructions are listed so that chemistry explorers can consider the solubility of potassium nitrate. They combine their results with those of other lab groups and then graph the data to display the solubility...
Curated OER
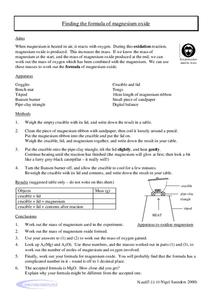
Finding the Formula of Magnesium Oxide
Rather than simply matching up the ionic charges on paper, this exercise gets chemists into the lab to determine the chemical formula for magnesium oxide! If a know amount of magnesium is used, an oxidation reaction results in this...
Curated OER
Engaging Young Scientists with Inquiry: Part Two
Evaluating data and learning to communicate the results is a big piece of the inquiry puzzle.
Curated OER
Planet Data
Sixth graders use various resources to locate information for a database (name of planets, diameter of planets, etc.). They enter the data onto a prepared data grid. Use of Access to sort data is accented within this lesson. Students...
Curated OER
The Effect of Dissolved Salt on the Boiling Point of Water
Explore the properties of solutions with a lab activity. Chemistry fans determine the boiling point of water, add salt to create a solution, and then repeat the process four more times. They design their own data table and then graph the...
Earth Day Network
Staying Green While Being Clean
Clean up the environment with a lesson that focuses on replacing hazardous cleaning supplies with green, environmentally-friendly products. Using a dirty patch of surface as a control area, kids clean other parts of various surfaces...
Curated OER
Fish Tank Territories
Young scholars observe swimming and resting patterns of aquarium fish to determine how different parts of the habitat are used. Different pairs of students should compare their results after several days to look for daily patterns.
Curated OER
One Sweet Experiment
This resource is designed to be used as a lab sheet when experimenting with the dissolution of sugar in water. It's very nice in that it follows the scientific method of experimentation. There are places for the definition of the...
Other popular searches
- 2008 Election Results
- American Revolution Results
- Experimental Results
- Discuss Election Results
- Resultant Velocity
- Federal Election Results
- Favorable Results
- Analysis of Results
- Heat Absorption Results
- Resultant Force
- Graphing Survey Results
- Resultant Vectors


