Curated OER
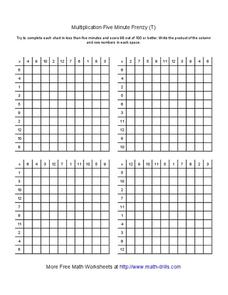
Multiplication Five Minute Frenzy (T)
In this multiplication chart worksheet, students fill in multiplication charts containing numbers 1 through 12. Students try to fill in 4 charts in 5 minutes each.
Curated OER
4 x 2 Chart
In this graphic organizer worksheet, students use the chart for any information recording purpose. There are 8 connected rectangles on the chart, with two rows of four columns. There are no directions for use.
Curated OER
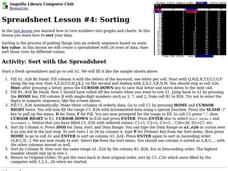
Sorting
Students examine how sorting is the process of putting things into an orderly sequence based on some key value. In this lesson students create a spreadsheet with 26 rows of data, then sort those rows by different values.
Curated OER
Technology Integration Lesson Plan: Civil War Spreadsheet
Eighth graders discuss and analyze Civil War data, manually graph data on handout, work with partners to enter data into spreadsheets, and create charts on spreadsheet for each data set.
Curated OER
Graphing Data on Ellis Island
Third graders use data to make a bar graph. In this graphing and social studies lesson, 3rd graders use data about where Ellis Island immigrants came from to complete a bar graph on Microsoft Excel.
Curated OER
A Fishy Tale
Eighth graders do a research project on a particular species of Atlantic seafood and record and graph information pertaining to commercial landings of that species of seafood. They use a website and an Appleworks spreadsheet.
Curated OER
And You Thought Gasoline Was Expensive!
Students carry out a cost analysis. In this comparative math lesson, students compare the cost of equal measures of gasoline to mouthwash, house paint, fruit juice, white-out, and other liquids.
Curated OER
Creating a Spreadsheet and Graph
Students create graphs in Excel. In this spreadsheet lesson, students input data into spreadsheet cells then use the graphing feature of the Excel program to produce colorful graphs of the data. The directions to create the...
Curated OER
Excel temperature Graphs
Students gather data about the weather in Nome, Alaska. For this Nome Temperature lesson, students create an excel graph to explore the weather trends in Nome. Students will find the average weather and add a trend line to their...
Curated OER
Synonyms
Students examine synonyms from their reading. In this synonyms lesson, students use vocabulary from their reading to create a chart and illustrate the words. Students complete online activities from the story.
Florida Center for Reading Research
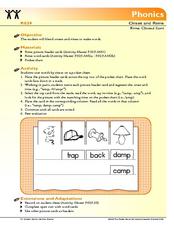
Phonics: Onset and Rime, Rime Closed Sort
Practice onset and rime with this word sort activity. Beginning readers lay out the four picture cards along the top of the chart: fan, cap, tack, and lamp. Then, they flip word cards and sort them beneath the image with the same rime....
Curated OER
Excel Lesson
Fifth graders will perform exercises and write the number of each exercise performed on the collection data sheet. They survey eight of their classmates for their exercise data and write that data on the collection data sheet. They then...
Curated OER
Don't Settle for a Byte... Get the Megabyte on Technology
Students use word processing, presentation, and spreadsheet software. In this multi-day computer software usage lesson, students complete a research project that requires the use of a word processor, Excel, FrontPage, and PowerPoint to...
Curated OER
Around the World
Young scholars discuss the major geographical and cultural differences in the world. In this social science lesson, students pretend they are traveling and research information about where they wish to stay by finding information about...
Curated OER
Product + 1: Integers
In this integers instructional activity, students solve 1 word problem using proof. Students prove their hypothesis of the result of multiplying four consecutive positive integers and adding one to the product.
Curated OER
Elements of Messages
Students examine media messages. In this media awareness lesson, students analyze political cartoons and identify the literary elements they incorporate. Students also use the Media Elements Handout to identify the elements in other...
Curated OER
Graphing
Fifth graders create graphs based on climate in South Carolina. They read and interpret information in a chart and construct a graphy from the information in the chart. They create a spreadsheet using Excel and publish 2 graphs.
Curated OER
Geograophy of Mexico And Central America
Students create a chart comparing the terrain, climate, economy, environmental issues and natural disasters for Mexico and the Central American countries. They view and discuss a video on the region then compile research on the internet.
Curated OER
Have Respect
Students learn the value of respect. In this Clifford the Big Red Dog lesson plan, students read the story, discuss respect, and experience a mini-international festival.
Curated OER
Getting There
Students practice reading a pictograph. In this data analysis lesson plan, students collect data and create their own pictograph. A students worksheet is included.
Curated OER
Life Expectancy at Birth
Students create a line graph on the life expectancy for males and females in Canada. In this math and health lesson plan, students review table and graph terminology, create line graphs, and analyze the differences in life expectancy...
Curated OER
Growing Rock Candy
Students observe the growth of rock candy. In this crystal growth lesson, students make rock candy and measure the crystal growth over five days.
Curated OER
Trends in Precipitation
Eighth graders study about precipitation and graph the information. They look for patterns in a scatter graph and make inferences based on what they see. They need to see a relationship between location and the amount of precipitation.
Curated OER
Batter Up
Students use a variety of strategies to figure out the cost of baseball tickets. They use a combination chart, notebook notation, etc. to find the cost of their family to attend a Cardinal's game in St. Louis.
