Curated OER
Charting and Graphing Sales
Students analyze graphs, charts and tables. For this data analysis lesson, students practice creating and analyzing charts, graphs and tables corresponding to sales and surveys. This lesson uses data relevant to students and includes...
Curated OER
Reading Timetable
Word problems, telling time, and reading charts all come together on this page. After reviewing a table of different travel times for a bus, a tram, a taxi, and a trolley, third graders solve word problems about arrival times and stop...
Curated OER
Students Favorites
Students complete activities using a frequency table and construct a pie graph for the data. In this frequency table lesson, students complete a survey to find data for a frequency table. Students use the given link to make a pie graph...
Curated OER
A Data Processing Lesson for Statistics -- Reading a Table or Chart
Learners identify the structure and key parts of tables and charts. They determine which data is meanjngful and make comparisons with the data. They describe the scope of the AIDS plague throughout the world.
Curated OER
Fractions and Measurement
Using a Smart Board, or a plain ol' white board or chalkboard, the teacher pulls up a grid and demonstrates how squares and rectangles can be divided up into equal parts. The class will get their own graph paper to draw shapes and divide...
Curated OER
Addition Chart (Blank)
In this addition facts worksheet, students fill in the sums on an addition chart with facts from 1 to 10. Students add the numbers in the rows and columns and place answers on the chart.
Curated OER
Addition Chart
In this addition worksheet, learners complete an addition chart by writing the sums of the numbers from 1 to 10. The numbers are not in order on the chart; students look at the factors in the rows and columns and add. Some numbers are...
Curated OER
Tally Charts
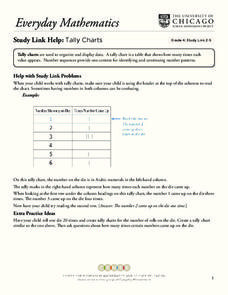
For this tally charts worksheet, students discuss how to use a tally chart and how to read the chart. Once students record information on a tally chart they answer questions showing their ability to read a tally chart.
Curated OER
Multiplication Five Minute Frenzy (A)
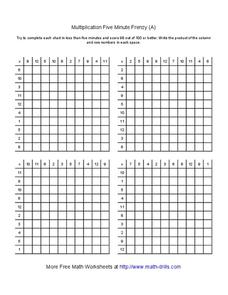
In this multiplication worksheet, 3rd graders will have 5 minutes to complete a multiplication chart with 10 numbers across the top and 10 down the side. Students must write the product of the column and row numbers.
Curated OER
Five Minute Adding Frenzy (B)
In this addition worksheet, young scholars complete a five minute addition frenzy sheet. They complete 4 charts finding the sums of the columns and rows in each space. They have five minutes to finish each chart with 98% accuracy.
Curated OER
Addition Grid Chart
In this addition worksheet, students fill in the squares in an addition grid. Students add the two numbers in the columns and rows. The addition facts are from 0 to 10.
Curated OER
State Economy Chart
Fifth graders research and record statistics on the economy of an assigned state. They create a spreadsheet in Excel to report the data and a 3D Pie graph using the Chart Wizard in Excel to represent their states' data.
Curated OER
Colorful Fractions
Students use charts to show fractions. In this fractions and percents instructional activity, students review fractions, percents and ratios. Students create tables and color the cells to make different fractions. ...
Curated OER
Five Minute Adding Frenzy (A)
In this five minute adding frenzy worksheet, students problem solve four charts containing a hundred addition equations in each in less than five minutes for each one.
Curated OER
Multiplication Five Minute Frenzy (P)
In this multiplication worksheet, students complete four 100 space multiplication charts. Students are timed for five minutes for each chart. Facts included are with factors from 1 to 12.
Curated OER
Multiplication Five Minute Frenzy (N)
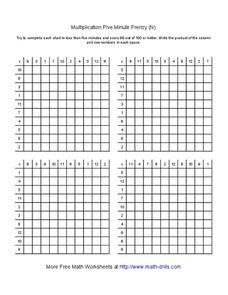
In this multiplication worksheet, learners complete four 100 space multiplication charts. Students are timed for five minutes for each chart. Facts included are with factors from 1 to 12.
Curated OER
The Elvis Magic Square Problem
In this secondary mathematics worksheet, students are provided with clues about Elvis’ life that are used to solve a magic square in which the sum of each row, column, and diagonal must all be the same. The one page worksheet...
Curated OER
Multiplication Five Minute Frenzy (Q)
In this multiplication chart worksheet, students fill in multiplication charts that contain numbers 1 through 12. Students try to fill in 4 charts in 5 minutes each.
Curated OER
Multiplication Five Minute Frenzy (S)
In this multiplication chart worksheet, students fill in multiplication charts containing numbers 1 through 12. Students try to fill in 4 charts in 5 minutes each.
Curated OER
Multiplication Five Minute Frenzy (T)
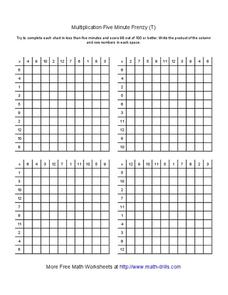
In this multiplication chart worksheet, students fill in multiplication charts containing numbers 1 through 12. Students try to fill in 4 charts in 5 minutes each.
Curated OER
Sorting
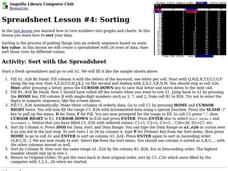
Students examine how sorting is the process of putting things into an orderly sequence based on some key value. In this lesson students create a spreadsheet with 26 rows of data, then sort those rows by different values.
Curated OER
Graphing Data on Ellis Island
Third graders use data to make a bar graph. In this graphing and social studies lesson, 3rd graders use data about where Ellis Island immigrants came from to complete a bar graph on Microsoft Excel.
Curated OER
And You Thought Gasoline Was Expensive!
Students carry out a cost analysis. In this comparative math lesson, students compare the cost of equal measures of gasoline to mouthwash, house paint, fruit juice, white-out, and other liquids.
Curated OER
Creating a Spreadsheet and Graph
Students create graphs in Excel. In this spreadsheet lesson, students input data into spreadsheet cells then use the graphing feature of the Excel program to produce colorful graphs of the data. The directions to create the...


