Curated OER
Geometric Sequences and Series
Learn to calculate the nth term of a sequence defined by an algebraic expression. They examine geometric sequences and series, relate geometric sequences to their explicit forms, find the partial sums of a sequence in a table, and...
Curated OER
TI-89 Activities for PreCalculus and AP Calculus
Using the TI-89 calculator, students explore the statistical, graphical and symbolic capabilities of the TI-89. Students investigate topics such as solving systems of equations, finding inverse functions, summations, parametrics...
Curated OER
Celsius to Fahrenheit
Students convert degrees between two different units. In this algebra lesson, students graph linear equations and identify the line of best fit. They use their line of best fit to make predictions given a set of data.
Curated OER
Domain and Range 2
How do you identify the domain and range of the function? As learners find out it's as easy as creating a graph. They'll identify the domain and range of a relation from its graph, write symbolic expressions describing the relationship...
Orlando Shakes
Arms and the Man: Study Guide
Few aspects of life make better fodder for a comedic play than politics. A study guide introduces George Bernard's Shaw comedy Arms and the Man. Along with summaries of each scene and brief biographies of the main characters, two lesson...
NOAA
The Oceanographic Yo-yo
How does chemistry help deep-sea explorers? Part four of a five-part series of lessons from aboard the Okeanos Explorer introduces middle school scientists to technologies used in ocean exploration. Groups work together to analyze data...
Curated OER
Infinite Geometric Series
Eleventh graders investigate infinite geometric series. In this Algebra II activity, 11th graders explore partial sums of geometric series, converging and diverging series, and sums of infinite geometric series. The...
Curated OER
Line of Best Fit
Students identify the line of best fit. In this statistics activity, students collect and analyze data. They calculate the regression equations and identify the different types of correlation.
Curated OER
Analyzing Graphs and Data
Students collect and analyze data. In this statistics lesson, students graph their data and make inferences from the collected data. They display their data using graphs, bar graphs, circles graphs and Venn diagrams.
Curated OER
Gender and Income
Students investigate Income and gender preference. For this statistic lesson, students collect data of Income to see if one gender makes more than the other. Students examine the data and draw conclusions.
Curated OER
Graphing Data from the Chemistry Laboratory
High schoolers graph and analyze data using a spreadsheet.
Curated OER
Price of Apples- Linear Data
Students collect data and create a graph. In this algebra lesson, students describe functions graphically, algebraically and verbally. They identify functions as being independent and dependent using variables.
Curated OER
Does Music Cam the Savage Beast?
Students collect, graph and analyze data. In this statistics lesson, students measure the heart beat of a person as they listen to music. They use the CBL and TI to create a graph, analyzing the outcome.
Curated OER
Coordinate Graphs, Translations and Reflections
Students perform translations and reflections. In this algebra lesson, students use the TI calculator to graph functions. They move the functions around on the coordinate plane using translation and reflection.
Curated OER
Precalculus: Function Models for Real-Life Situations
Learners use calculators and "by hand" techniques to compare models of real-life data situations, determine the best model for a situation, and use their models to make predictions.
Curated OER
Equations With Radical Expressions
Students solve systems of equations with radical expressions. After reading real life situation, they translate the problem into algebraic expressions. As a class, students solve quadratic equations and inequalities by graphing and...
Curated OER
Education for Global Peace
Students survey the class and graph the results. In this graphing and data collection lesson, students conduct a survey to see where their shirts were produced. Individuals use software to graph the results and create a written...
Curated OER
Graph Made Easy: Post Test
In this graphs worksheet, students answer multiple choice questions about line graphs and bar graphs. Students answer 10 questions total.
Curated OER
Modeling Population Growth
Students collect data on population growth. In this statistics lesson, students graph their data and make predictions. They find the linear regression and the best fit line.
Curated OER
Comparison of Two Different Gender Sports Teams - Part 1 of 3 Measures of Central Tendency
Young scholars gather and analyze data from sports teams. In this measures of central tendency lesson, students gather information from websites about sports team performance. Young scholars analyze and draw conclusions from this data....
Curated OER
Building a Pill Bug Palace
Students make "pets" of isopods (potato bugs) to determine their preferred environment and food sources. They record their results on a bar graph and in a scientific report.
Curated OER
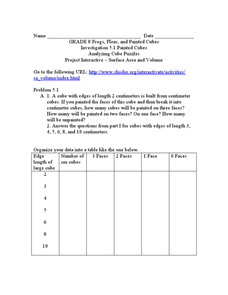
Analyzing Cubes
In this analyzing cubes worksheet, 9th graders solve and complete 6 different types of problems. First, they organize the given data into the table provided. Then, students study the patterns in the table and tell whether the pattern of...
Curated OER
Linear Patterns in Data
Eighth graders extend their learning of graphing linear equations and are introduced to connecting patterns in tables and graphs to represent algebraic representations. They then determine patterns and extrapolate information from these...
Curated OER
What Pie?
Students practice making and interpreting pie graphs so they are better able to decide if a pie chart is the appropriate form of display. Students examine included overheads of different pie charts, and directions on how to make pie...
Other popular searches
- Creating a Scatter Plot
- Scatter Plot Graphs
- Math Scatter Plots
- Scatter Plot Project
- Scatter Plot Trend Line
- Algebra Scatter Plots
- Creating Scatter Plots
- Scatter Plot Worksheets
- Correlating Scatter Plot
- Candy Scatter Plots
- Scatter Plot Notes
- Data for Scatter Plots


