Curated OER
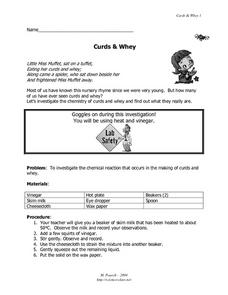
Curds and Whey
In this chemical reaction worksheet, learners investigate the reaction that makes curds and whey. They mix milk and vinegar and run it through cheesecloth to collect the solid. Students make observations, read about curds and whey, and...
Curated OER
Biodiversity Debate - Stream Side Science
Role play community members who are both for and against the construction of a dam. Research the pros and cons and then hold a classroom debate. This activity ideally follows a series of stream studies, links to which are included. Use...
Curated OER
Carbon Monoxide and Population Density
Tenth graders investigate the carbon monoxide level at a fixed latitude to determine if there is a relationship to population density. They download data sets and generate a graph, and find locations using the Earth's coordinate system....
Curated OER
Forces and Graphing
Learners analyze graphs to determine relationships between variables and rates of change. They determine the basic concepts about static reaction forces. They determine the slope and equation of a line.
Curated OER
The Affect of Water Temperature on Living Organisms
Students examine the environmental impact of global warming. In this environmental science lesson, students design and conduct an experiment about the effect of temperature on paramecia. They write a lab report about their experiment.
Curated OER
Building A Nation
Students build their own nation in groups where they create a name, flag, declaration of independence, form of government, mathematical layout, and more. In this nation lesson plan, students also provide a scale drawing of their nation...
Curated OER
Measuring Temperature and the Production of CO2 in Yeast
Young scholars use a model experiment to complete an experiment on yeast. In groups, they identify the independent and dependent variables and use the scientific method to complete the activity. They record their observations and discuss...
Curated OER
Discovering Albedo
Students read a thermometer accurately, collect and record data, and generate a graph based on data. They learn what independent and dependent variables are. They analyze data and make conclusions concerning how soil coverings affect...
Curated OER
Mechanical Properties
Students explore the concept of hardness. In this physical science lesson plan, students will be using clay heated at different temperatures to study hardness based on the indention left. Students will also be identifying the variables...
Curated OER
Adding Creativity to Science Inquiry
Students investigate friction by manipulating some of the variables affecting it. In this inquiry lesson, students design their own experiment. They create a video about it and share it to class.
Consortium for Ocean Science Exploration and Engagement (COSEE)
Carbon Dioxide & Krill: Impacts
What effects do temperature and carbon dioxide levels have on the zooplankton of Antarctica? This concluding lesson plan in a short unit on climate change and the ocean helps environmental scientists answer these questions. After...
Curated OER
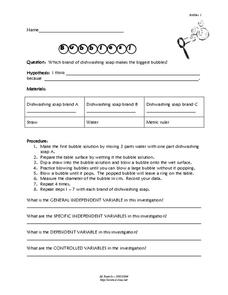
Bubbles
Students experiment bubbles. In this scientific method lesson, students identify variables used in proper experiment design. Students conduct experiments with different brands of dish-washing detergent to determine which brand makes the...
Curated OER
Using The Scientific Method
Middle schoolers are given a problem or hypothesis, they can create a relevant experiment using the steps to the scientific method. They collect quantitative and qualitative observations in scientific experiments. Students identify the...
Curated OER
Survival
Students determine the best material from which to make a jacket to keep the body warm in a cold, dry, windy climate. This task assesses the student's ability to perform an entire investigation. In this question the independent...
Curated OER
Where do Plants Get their Food?
In this where do plants get their food worksheet, learners design an experiment that will disprove the idea that plants obtain their food from soil. Students will set up their experiment and design a data table that will record data over...
Curated OER
Use Scientific Method to Solve Problems
Students are given a set problem, they use the scientific method to solve the problem using all steps of the scientific research. Students list the steps of the scientific method used in solving a problem. They are given a selected...
Curated OER
Marble Madness
Students determine the velocity of a marble rolling down the incline. In this physics instructional activity, students identify the independent and dependent variables in the experiment. They construct and analyze a graph.
Curated OER
Hare vs. the Tortoise
Seventh graders identify and create questions and hypotheses, dependent and independent variables and form a conclusion that can be answered and tested through scientific experimental investigation. In this relationship lesson, 7th...
Kenan Fellows
Saving Those Who Save Us: Exploring the Use of Sensors with Data Visualization
Sensor technology is amazingly accurate and useful. Combining the sensor technology and mathematical knowledge, scholars design experiments to answer a question they have developed. Questions may focus on light sensing, temperature...
PHET
Planet Designer: Kelvin Climb
It's time to get those creative juices flowing! This second instructional activity in a series of five continues allowing pupils to design their own planets. It the same format as the first, but, this time, allows students to alter...
Curated OER
Seed Growth
Students develop an independent procedure to investigate the germination of two types of seeds. Students must construct data tables or charts to record observations and results, graph the data, and analyze the data.
Curated OER
Bar Graphs
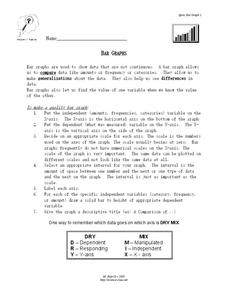
In this bar graph worksheet, students read about making quality bar graphs and they make a bar graph using given data. They answer 5 questions about their graph.
Curated OER
pH Testing
Students explore the use of variables in the scientific method. They identify the dependent and independent variables through pH testing. Students construct graphs of their data and analyze their findings.
Curated OER
Graphing in Science
Students manipulate and interpret data. They are given a dataset from a described experiment and interpret the data. A "How to Sheet for graphing" is included in lesson plan.
