Virginia Department of Education
Independent and Dependent Variables
Investigate the relationship between independent and dependent variables. Individuals begin by identifying independent and dependent variables from different problem situations. Then, using specific guidelines, they create posters...
Shodor Education Foundation
Scatter Plot
What is the relationship between two variables? Groups work together to gather data on arm spans and height. Using the interactive, learners plot the bivariate data, labeling the axes and the graph. The resource allows scholars to create...
BW Walch
Creating and Graphing Linear Equations in Two Variables
This detailed presentation starts with a review of using key components to graph a line. It then quickly moves into new territory of taking these important parts and teasing them out of a word problem. Special care is taken to discuss...
Shodor Education Foundation
Incline
Study velocity while examining graphical representations. As scholars work with the animation, they discover the effect the height of an incline has on the velocity of the biker. They make conclusions about the slope of the line in terms...
Shodor Education Foundation
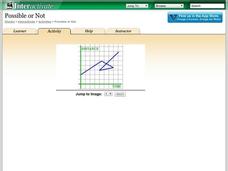
Possible or Not?
What does the graph mean? Pupils view 10 graphs and determine whether they are possible based on their contexts. The contexts are distance versus time and profit versus time.
Kenan Fellows
Saving Those Who Save Us: Exploring the Use of Sensors with Data Visualization
Sensor technology is amazingly accurate and useful. Combining the sensor technology and mathematical knowledge, scholars design experiments to answer a question they have developed. Questions may focus on light sensing, temperature...
Curated OER
Algebra 1
Students study the functional relationships of a variety of problems. In this functional relationship lesson, students determine the dependent and independent quantities of a given set of data. Students record the data and write it in...
EngageNY
Rearranging Formulas
Model for your learners that if they can solve an equation, they can rearrange a formula with a well-planned lesson that has plenty of built-in practice. As the lesson progresses the content gets progressively more challenging.
Curated OER
Spreadsheet Function Machine
Students create a spreadsheet to analyze functions. In this algebra lesson, students use spreadsheets to find the intersection of systems of equations. They identify the dependent and independent function as it relates to a line.
Curated OER
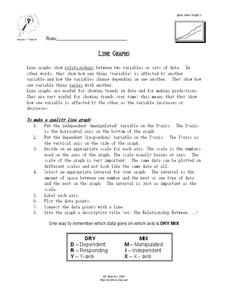
Line Graphs
In this algebra worksheet, students describe the relationship between a line graph and its data. They define the reasons line graphs are used and discuss increasing and decreasing lines. There is one involved questions, requiring several...
Curated OER
Scatter Plots
For this Algebra I/Geometry/Algebra II worksheet, students create a scatter plot and analyze the data to determine if the data show any type of correlation. The four page worksheet provides extensive explanation of topic, step-by-step...
Shodor Education Foundation
Multiple Linear Regression
You'll have no regrets when you use the perfect lesson to teach regression! An interactive resource has individuals manipulate the slope and y-intercept of a line to match a set of data. Learners practice data sets with both positive and...
Curated OER
How Alike Are We?
Fourth graders find the range, mode, median, and mean for each of the data sets (height and shoe size). They discuss which measure of central tendency for each data set best represents the class and why. Students graph the shoe size and...


