Curated OER
Numbers Beyond Reason!
Fourth graders use the story of the discovery of irrational numbers to explore the different classes of numbers, the different ways in which numbers may be represented, and how to classify different numbers into their particular class.
Curated OER
The Magic Squares
Fifth graders devise and use problem solving strategies to solve a magic square arrangement. In small groups they explore various strategies including non-algebraic and algebraic techniques, write an explanation of their solution, and...
Curated OER
Unequal Groups vs. Equal Groups
Third graders read and discuss math story problems and analyze if the story is using equal groups or unequal groups. They listen to the book "12 Ways To Get to 11," and simulate the story using beads on a pipe cleaner. Students then...
Curated OER
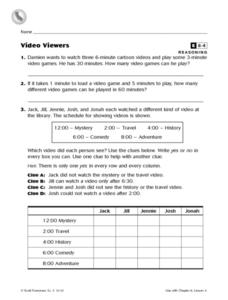
Video Viewers
In this video viewers worksheet, 3rd graders solve 2 word problems dealing with watching videos, read and analyze 4 clues in order to fill in a chart correctly involving 5 people and the types of videos they watch.
Curated OER
Product + 1: Integers
In this integers instructional activity, students solve 1 word problem using proof. Students prove their hypothesis of the result of multiplying four consecutive positive integers and adding one to the product.
Curated OER
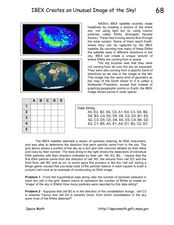
IBEX Creates an Unusual Image of the Sky!
In this IBEX satellite worksheet, students read about the Energetic Neutral Atoms that are detected by the IBEX satellite. Students use a given hypothetical data string to determine the number of particles detected and create an 'image'...
Curated OER
Nine Examples for Tables, Pictographs, Mean. Median, and Mode
In this graphical representation of data and measures of central tendency worksheet, students calculate mean, median, and mode and answer questions related to graphs, tables, and pictographs.
Curated OER
More No-Three-In-A-Line
Fourth graders read Mary's problem and make sure that they examine it.
After some discussion, let the class work on the problem in their groups.
They then take turns in putting a picture of their arrangement on the board.
Curated OER
No-More-In-A-Line
Students and teacher discuss square windows and their symmetry. Students work on the problem given and discuss any difficult ideas. They work in groups to use a systematic approach to get all possible answers.
Curated OER
Ten More and Ten Less
Get learners to analyze two-digit numbers based on place value, and use manipulatives to add and subtract both 1 and 10. A place value chart is available, and you can project it during guided practice. Through visualizing...
Curated OER
Heads & Tails Data Collection
In this data collection worksheet, students use a penny and a dime to play a math game. Students flip the money in the cup and then record the number of heads and tails showing marking the coins in the box.
Curated OER
Graphing
Fifth graders create graphs based on climate in South Carolina. They read and interpret information in a chart and construct a graphy from the information in the chart. They create a spreadsheet using Excel and publish 2 graphs.
Curated OER
Visual Multiplication
In this math worksheet, students practice solving the problems to introduce the concept of multiplication with countable visuals. The sheet is a teacher's guide
Curated OER
Reinforcement Lesson in Place Value
Learners order digits to create the highest or lowest possible number. They roll a die, and determine where to place the number according to their place value, ordering the numbers to create the highest or lowest number.
Curated OER
Making Arrays
In this making arrays worksheet, pupils, working with a partner, study and calculate how to make arrays by completing six exercises.
Curated OER
Graphing Integers
Fifth graders explore the math concept of graphing integers. For this graphing integers lesson, 5th graders examine visual examples. Students also practice solving problems that their instructors model.
Curated OER
Equivalent Fraction Bingo
Students participate in a game of Fraction Bingo. In this fraction lesson, students review equivalent fractions and use these skills to play Fraction Bingo.
Curated OER
Math Puzzle: Numbers 0-4
In this math puzzle worksheet, students fill in numbers 0-4 in squares equaling the same sum going across and down. Answers are included on page 3.
Curated OER
Where's the Period in the Periodic Tables?
Students investigate the Periodic Table of Elements. The teacher is provided with the necessary background information to complete the lesson. Students practice matching the element symbol to its place on the chart.
Curated OER
How Do You Do Your Homework?
Students answer a homework quiz and create a timetable to make sure their work is handed in on time. They also study tips on how to tackle homework and investigate the meaning of homeworkaholic and effortaphobe.
Curated OER
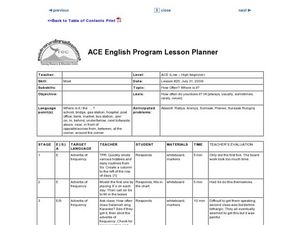
How Often? Where is it?
Students explore language arts by completing vocabulary worksheets. In this directions lesson, students identify terms and vocabulary words which assist in finding locations and giving directions. Students complete a worksheet about the...
Curated OER
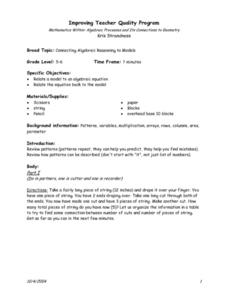
Connecting Algebraic Reasoning to Models
Students analyze relating a model to an algebraic equation and visa versa. Patterns are reviewed in detail and then in pairs new models are created and then translated into a word problem or equation. They illustrate their models on...
Curated OER
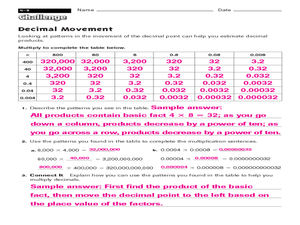
Estimating Products with Decimal Movement
In this estimating products with decimal movement worksheet, 5th graders multiply to complete the table, then answer three questions about the patterns in the movement of the decimal point.

