Curated OER
Age and Sex
Students create and analyze a population pyramid based on age and sex data from the 2001 Census. They explain and interpret the population pyramid other students have produced.
Statistics Education Web
Are Female Hurricanes Deadlier than Male Hurricanes?
The battle of the sexes? Scholars first examine data on hurricane-related deaths and create graphical displays. They then use the data and displays to consider whether hurricanes with female names result in more deaths than hurricanes...
Curated OER
Population-Building a Foundation
Students research to find information about populations and complete world maps by labeling the current population, and determining the 10 countries with the largest population. They search the "World Population Data Sheet." On the third...
Curated OER
Santa's List Sums (E1)
In this adding single digit numbers worksheet, students observe a chart of street names, boys, and girls and add the total number of boys and girls on each street, the total number of children, and the total number of each sex. Students...
Curated OER
Santa's List Sums (Hi)
In this adding single digit numbers worksheet, students observe a chart of street names, boys, and girls and find the total number of boys and girls on each street, the total number of children, and the total number of each sex. Students...
Curated OER
Santa's List Sums (Ii)
For this adding single digit numbers worksheet, students observe a chart of street names, boys, and girls and find the total number of boys and girls on each street, the total number of children, and the total number of each sex....
Curated OER
Santa's List Sums (J3)
In this finding the sums worksheet, learners view a chart of street names and numbers of boys and girls, add the total number of children on each street, the grand total number of children, and the total number of each sex. Students...
Curated OER
Santa's List Sums (I3)
In this finding the sums instructional activity, student observe a chart of street names and numbers of boys and girls, add the number of children on each street, the grand total of children, and the total number of each sex. Students...
Curated OER
How does Your Province Stack Up?
Students investigate data about age, and sex of a population. For this statistics lesson, students are given data on a population to analyze and compare to other provinces. This assignment is part of a geography lesson and requires 3...
Curated OER
Crime School Investigations
Learners solve a mystery at their school. In this classifying lesson plan, students find suspects who committed the crime. Learners categorize them into race, sex, and fingerprint type. Students show their results in graphs.
Curated OER
Teen Pregnancy: Investigating Cubic Functions
In this teen pregnancy learning exercise, students use a scatter plot and cubic functions to solve word problems about teen pregnancy. Students complete 7 problems.
Curated OER
Baby Project - Cost Analysis - First Year of Life
Young scholars determine the costs associated with teenage pregnancy and childbirth through the child's first year. They consider prenatal and postnatal care for mother and child, clothing, food, equipment, childcare, etc. They present...
Curated OER
Closing the Salary Gap
Students explore careers in their community and compare the average salaries for men and women working in those careers. They explore a variety of careers available in their community through participating in this lesson.
Curated OER
All Choked Up By Smoking Statistics
Scholars use the article "More College Learners Are Smoking, Study Says" as a springboard for discussion on the reasons why people smoke cigarettes. They investigate different methods of graphing statistics by using the data provided in...
Curated OER
The Minority Majority
Students design a census class and school, then tabulate the results. They respond to a sample census, then reflect on why questions of race and national origin are different.
Curated OER
What's in a Number? Analyzing Smoking Statistics
Sixth and seventh graders analyze smoking statistics. In this health instructional activity, learners look at the percentage of people who smoke from each race group. They create a bar graph and circle graph that displays this...
Curated OER
Red Worms Rock!
Second graders measure red worms. In this lesson, 2nd graders observe and collect data on red worms. Students measure the red worms and create a graph with the data they collect.
Curated OER
K-5 Mathematics Module: Number and Number Sense
Reinforce number sense with a collection of math lessons for kindergarteners through fifth graders. Young mathematicians take part in hands-on activities, learning games, and complete skills-based worksheets to enhance proficiency...
Learning Games Lab
Nitrogen in Fertilizer
Nitrogen is an essential element for productive farming. An interactive lesson explores the chemical makeup of different fertilizers and their corresponding nitrogen content. The interactive challenges individuals to complete...
Learning Games Lab
Nitrogen in Pollutants
Responsible farming is important for maintaining natural resources. Eager scientists complete a WebQuest to explore what happens to nitrogen when it enters the soil. They learn about the chemical makeup of nitrogen-based molecules...
Learning Games Lab
Scientific Graph Reading
Interpreting graphs is an essential skill for young scientists. An interactive online lesson gives individuals an opportunity to review the components of a graph and learn to read and interpret the shape of a graph. The lesson includes...
Learning Games Lab
The Magic of Reading Graphs
Making conclusions from graphs doesn't need to seem like magic. Learners explore an interactive lesson on reading graphs to strengthen their skills. The content discusses how to read the axes of a graph and draw conclusions based on the...
Learning Games Lab
Logarithm Calculator
Support your young scientists' knowledge of logarithms with a quick video lesson. The instruction first presents the relationship between a base-10 logarithm and an exponential equation. It then demonstrates how to use a calculator to...
Curated OER
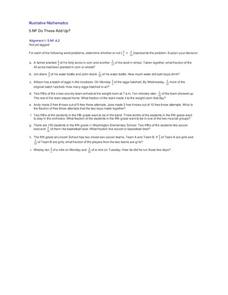
Do These Add Up?
Common Core mathematical practices require that young mathematicians not only know how to add fractions with unlike denominators, but also to recognize when adding fractions are appropriate for the word problem. Fifth graders are given...
Other popular searches
- Sex Education
- Battle of the Sexes
- Adult Education (Sex)
- Sex Linked Traits
- Sex Education Programs
- Sex Ed
- Safe Sex
- Sexual Health
- School Sex Education
- Sex Education Special Needs
- Sex Chromosomes
- Sex Linked Chromosomes


