Curated OER
The Power of Graphical Display: How to Use Graphs to Justify a Position, Prove a Point, or Mislead the Viewer
Analyze different types of graphs with learners. They conduct a survey and determine the mean, median and mode. They then identify different techniques for collecting data.
Curated OER
A Climate Conundrum
After viewing a video and reading an article about the threatened turtles and tortises in The Amazon River area, collaborative groups create a poster or presentation about how we can help them. Several links to other related lesson plans...
Curated OER
Thesis statements: The Six Basic Claim Types
Evaluative or Analogical? The wolf in the story of "The Three Little Pigs" and the wolf in "Red Riding Hood" represent what can happen to the unprepared. Despite his defeat in the end, the Big Bad Wolf is a good example for kids because...
Curated OER
Dandelion Wine: Questioning Strategy
Readers of Dandelion Wine work in groups to develop questions on four levels (right there, think and search, the author and you, and on my own) about Chapter 34 of Ray Bradbury's reflection on the joys of summer. Groups jigsaw and then...
Illustrative Mathematics
Puzzle Times
Give your mathematicians this set of data and have them create a dot plot, then find mean and median. They are asked to question the values of the mean and median and decide why they are not equal. Have learners write their answers or...
Incredible Art
1, 2, and 3-Point Perspective
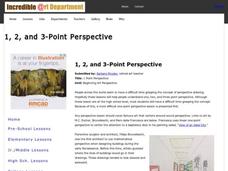
Introduce drawing learners to perspective with a series of lesson that detail how to draft images in one-, two-, and three-point perspective. Each exercise includes step-by-step, illustrated directions and examples.
EngageNY
Normal Distributions (part 1)
Don't allow your pupils to become outliers! As learners examine normal distributions by calculating z-scores, they compare outcomes by analyzing the z-scores for each.
EngageNY
Describing Center, Variability, and Shape of a Data Distribution from a Graphical Representation
What is the typical length of a yellow perch? Pupils analyze a histogram of lengths for a sample of yellow perch from the Great Lakes. They determine which measures of center and variability are best to use based upon the shape of the...
College Board
Is That an Assumption or a Condition?
Don't assume your pupils understand assumptions. A teacher resource provides valuable information on inferences, assumptions, and conditions, and how scholars tend to overlook these aspects. It focuses on regression analysis, statistical...
College Board
So Much Data, So Little Time
Organizing data in a statistics class is often a challenge. A veteran statistics teacher shares data organization tips in a lesson resource. The instructor shows how to group data to link to individual calculators in a more efficient...
Illustrative Mathematics
Haircut Costs
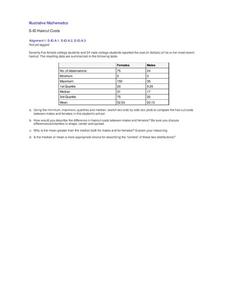
Who pays more for haircuts, men or women? Given quartile values, learners construct box and whiskers plots and interpret the results. They compare the mean and median, and discuss which is more appropriate under particular conditions....
Georgia Department of Education
The Basketball Star
Have learners use math to prove they are sports stars! Assess a pupil's ability to create and analyze data using a variety of graphs. The class will be motivated by the association of math and basketball data.
Curated OER
Political Polls
Students explore politcical polling by conducting a poll of student body elections. They prepare a survey, distribute forms, and tabulate data.
Curated OER
Long Vowel U Sounds
This worksheet is straight-forward and easy to follow. Have your young learners look at the words below and place them in the correct category. Does the word have the ew letter combination or a u and silent e combination? For you very...
Curated OER
China's Population Growth
Learners collect data from China's population growth and determine the mean, median, and mode from the data. For this data lesson plan, pupils determine probabilities and use them to make predictions.
Curated OER
Amelia Earhart - Drawing Conclusions
Examine the life of Amelia Earhart with kids. They will read facts and view a timeline about Earhart's life. They will work in groups to read the last radio transmissions and draw conclusions about what happened in her disappearance and...
Curated OER
Do You Have a Blog?
Ask learners about their personal writing habits, such as whether they keep a journal or a blog, or if they'd ever want to. Though this is not a fully developed instructional activity, you can use this article and question to provoke...
Illustrative Mathematics
Puppy Weights
Nobody can say no to puppies, so lets use them in math! Your learners will take puppy birth weights and organize them into different graphs. They can do a variety of different graphs and detail into the problem based on your classroom...
Mr. Roughton
Pawn Stars: Africa
What element was worth more during the growth of empires in West Africa: gold or halite? After examining various pieces of evidence of primary and secondary source documents placed around the room, your class members will each make a...
Curated OER
Angling Your Way Through a Picture
Learners look at the geometry in an artwork. In this art history/geometry lesson plan, students research the artist Charles Sheeler and look at his painting Stacks in Celebration. They find the different types of lines, angles, and...
Curated OER
EOC Review G
In this end of course review, students factor expressions, interpret statistic problems, and identify the maximum and minimum of equations. This two-page worksheet contains 5 multi-step problems.
Texas Instruments
Points, Lines, and Planes
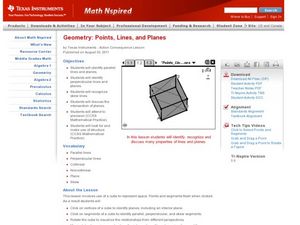
Students solve problems dealing with points, lines and planes. In this geometry instructional activity, students differentiate between parallel lines and planes. They find the intersection of lines and planes.
Curated OER
There's Gold in Them Thar Ratios
Students draw a model of the bunny problem which generates the Fibonacci Sequence, spirals generated from golden rectangles and golden triangles; identify the golden ratio in the human body, and find the Fibonacci numbers in nature.
Curated OER
Death and Taxes
Students explore the "death tax" and analyze statistical information about how the government taxes dead people. They research sources to determine the validity of a anti-tax group campaign and John McCain's claims about taxes. ...
Other popular searches
- Skew Lines
- Parallel Skew Lines
- Dispersion and Skewness
- Skew and Parallel Lines
- Geometry Skew Lines
- Skewed Statistics
- Skew Rays
- Skewer
- Angle Skew


