Curated OER
Slope, Vectors, and Wind Pressure
A hands-on lesson using the TI-CBR Motion Detector to provide information to graph and analyze. The class uses this information to calculate the slope of motion graphs and differentiate scalar and vector quantities. There is a real-world...
Curated OER
A Sweet Drink
Students investigate reaction rates. In this seventh or eighth grade mathematics lesson, students collect, record, and analyze data regarding how the temperature of water affects the dissolving time of a sugar cube. Studetns...
Curated OER
Slope of a Line
For this slope of a line worksheet, students read about line graphs and plotting the slope of a line. They read about the rate of change which is represented by the slope. Students practice finding the slope of lines.
Curated OER
Keep it Bottled Up: Linear Rates of Pressure Increase
Pupils explore linear functions in this lesson when they collect and analyze data as a chemical reaction proceeds. Learners record pressure versus time data and model the data as a linear function. They also examine the concept of slope...
Curated OER
Drug Sales Soar - Rate of Change
In this prescription drug worksheet, students answer short answer questions and create graphs on the sales of prescription drugs over a five year span. Students complete six questions.
Curated OER
Rates and Slopes: An Astronomical Perspective
In this rates and slopes activity, students solve 2 problems where they find the rate corresponding to the speed of the galaxies in a Hubble diagram for galaxies and they calculate the rate of the sunspot number change between indicated...
Curated OER
Animal Skin
Students investigate the skin surface to body area ratios for different animals. In this seventh/eighth grade mathematics/science lesson, students explore heat transfer between an animal’s body and the environment. Using...
Texas Instruments
TI-Nspire™ CAS
When it comes to rating educational calculators, this calculator is always near the top of this list. Now it's available as an app. There is a lot of calculator power wrapped up in this app. Not only is this a fully functioning...
Curated OER
AP Chemistry-Chemical Kinetics
In this kinetics worksheet, students find rate laws of reactions, they determine rate constants, they find rate-determining steps of reactions, they find half-life's of reactions and they determine the overall order of reactions.
Curated OER
Determination of a Rate Law
High schoolers determine the rate law for a chemical reaction. They use graphical techniques in the analysis of experimental data.
Curated OER
Walking Home II
Students explore the relationship between distance and time. They analyze a situation involving distance traveled in a given period of time, represent the situation graphically and algebraically, and discuss the concept of slope as a...
Curated OER
Is there Treasure in Trash?
More people, more garbage! Young environmentalists graph population growth against the amount of garbage generated per year and find a linear model that best fits the data. This is an older resource that could benefit from more recent...
Curated OER
Active Wear
Middle schoolers interpret and analyze data. In this middle school mathematics lesson plan, students conduct an experiment in which they investigate which solar collector, black, white, or silver, absorbs the most heat. ...
National Council of Teachers of Mathematics
Varying Motion
For this secondary mathematics learning exercise, high schoolers collect data based on a person’s motion. From this data, learners create graphs comparing displacement, velocity, and acceleration to time. The five-page learning exercise...
Cornell University
Math Is Malleable?
Learn about polymers while playing with shrinky dinks. Young scholars create a shrinky dink design, bake it, and then record the area, volume, and thickness over time. They model the data using a graph and highlight the key features of...
Nevada Outdoor School
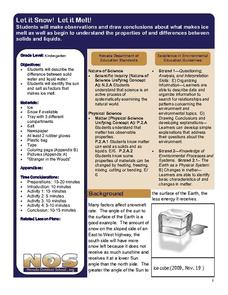
Let It Snow! Let It Melt!
Winter weather offers a great opportunity to teach young scientists about the states of matter. This activity-based lesson includes a range of learning experiences, from experimenting with the rate at which ice melts...
InqueryPhysics
Interpreting Motion Graphs
Every movement in the world can be measured and even motionless objects can be significant indicators of movement. Focus on motion graphs that feature distance vs. time, speed vs. time, and positive and negative acceleration.
Curated OER
The International Space Station
In this International Space Station worksheet, students are given the altitude changes in the space station on a graph from 2000-2004. Students answer 5 questions about the trends in the graph, the changes in altitude, the reason for the...
Curated OER
Water in the Texas Coastal Basins
Students, after researching a Texas coastal basin, map and graph the information they collect and then translate it into a short report to be presented to their classmates. They brainstorm unique ways to maintain Texas estuaries as well...
Port Jefferson School District
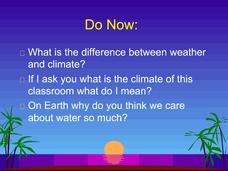
Water and Climate
Dive into a lesson on the hydrosphere with this Powerpoint presentation. Building on prior knowledge of the water cycle, young scientists learn what happens to water after it falls as precipitation and explore the...
Curated OER
Studying Plant Development Through Metabolic Activity
A hands-on activity which allows young scholars to learn about cellular respiration. This lesson contains a range of investigations testing the rates of cellular respiration to demonstrate the relationship between metabolic rates of...
Curated OER
Velocity and Acceleration
Compliment your physics lesson with this PowerPoint which demonstrates many important points regarding acceleration and velocity. A starter experiment activity to stimulate student thinking is given, and may prove very interesting to a...
Curated OER
How Texas is Planning To Manage Its Water
Students research water management strategies in Texas. They analyze projected demand for water in the year 2050, interpret graphs and tables and then discuss the data as part of a written report. They research and map the locations of...
Foundation for Water & Energy Education
How is Flowing Water an Energy Source? Activity C
Can the force of falling water through a tube vary by altering the diameter of the tube or its height? That is what physical scientists aim to discover in this activity, the third in successively more revealing activities on the power of...


