Curated OER
Perpendicular and Angle Bisectors
In this geometry worksheet, 10th graders solve problems that are based on the theorems associated with perpendicular and angle bisectors of a triangle. An application on the coordinate plane is included. The one page...
Curated OER
Rate of Change
Students observe and calculate slopes. In this algebra lesson plan, students graph equations and determine the pace at which the slope is changing. They use the navigator to see the change as they graph the lines around.
Curated OER
Pythagorean Theorem
For this Pythagorean theorem worksheet, 9th graders solve and complete 6 various types of problems. First, they find the length of a right-angled triangle's hypotenuse. Then, students determine which triangle is described and explain...
Curated OER
Average Rate of Change, Difference Quotients, and Approximate Instantaneous Rate of Change
Pupils, with the assistance of their TI-84 Plus / TI-83 Plus calculators, distinguish meanings from right, left and symmetric difference quotients that include rate of change and graphical interpretations. They utilize symmetric...
Curated OER
Strike a Pose: Modeling in the Real World (There's Nothing to It!)
Adjust this activity to fit either beginning or more advanced learners. Build a scatter plot, determine appropriate model (linear, quadratic, exponential), and then extend to evaluate the model with residuals. This problem uses...
Virginia Department of Education
Linear Curve of Best Fit
Is foot length to forearm length a linear association? The class collects data of fellow scholars' foot length and the length of their forearms. They plot the data and find a line of best fit. Using that line, they make predictions of...
Balanced Assessment
On Averages and Curves
Determine the average on a curve. The class finds graphical representations of averages and expresses them both symbolically and on the graph. The assessment requires class members to justify using average to describe graphs.
American Statistical Association
What Fits?
The bounce of a golf ball changes the result in golf, mini golf—and a great math activity. Scholars graph the height of golf ball bounces before finding a line of best fit. They analyze their own data and the results of others to better...
EngageNY
Analyzing a Graph
Collaborative groups utilize their knowledge of parent functions and transformations to determine the equations associated with graphs. The graph is then related to the scenario it represents.
Curated OER
Worksheet 14
In this math worksheet, students analyze a path around a circle. The interval is defined. Students sketch a graph of a given parametric curve. Five application problems give students practice using these concepts in real life situations.
Curated OER
Gilligan's Island
Students investigate topographical maps and match actual landforms to them. In this topographical maps lesson students create "Gilligan's Island" to scale then answer questions about it such as what the highest elevations is and...
Curated OER
Introduction to Tangent Lines using the TI-Nspire
Young scholars make mathematical argument using the concept of Limit. In this algebra lesson, student calculate the instantaneous rate of change from the linear graph. They use a TI-calculator to create a visual of the graphs.
Curated OER
Graphing Linear Equations
Ninth graders review the information that they have already learned
with regard to linear equations and graphical representations. They then assist in combining equations with a graphical element and complete various graphs with this...
Curated OER
Lines of Fit
Students solve equations dealing with best fit lines. In this algebra lesson, students solve problems by analyzing data from a scatterplot, and define it as positive, negative or no correlation. They classify slopes the same way as...
Curated OER
3.14159265
Young scholars discover the value of Pi. In this value of Pi lesson, students measure the circumference and diameter of various circles on their graphing calculator. Young scholars find the ratio of the circumference to the...
Curated OER
Salad Tray 3D Topographic Model
Students explore the characteristics of topographical maps. They examine the relationship of contour lines and vertical elevation. Students create a three-dimensional model of a landscape represented by a topographic contour map.
Alabama Learning Exchange
Graphing Stations
Students explore the concept of graphing stations. In this graphing stations lesson, students head to various teacher set-up stations involving slope, point-slope, standard form, parallel lines, etc. Students work problems at...
Mathematics Vision Project
Module 7: Modeling with Functions
The sky's the limit of what you create when combining functions! The module begins with a review of transformations of parent functions and then moves to combining different function types using addition, subtraction, and...
Curated OER
Lesson #67 Relative Extrema
Students test for relative extrema. In this Calculus lesson, 12th graders investigate the relative extrema of a function and sketch the curve from the given information without the use of a calculator.
Curated OER
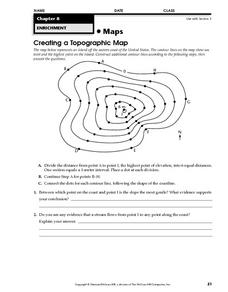
Creating a Topographic Map
In this topographic map worksheet, students add contour lines to a topographic map using instructions provided. Once topographic map is finished, students complete 2 follow-up short answer questions.
Curated OER
Graphing
Students collect data and graph their results, then analyze the graphs. In this geometry lesson, students examine slopes and their graphs and discuss the relationship between the lines and the slopes.
Curated OER
Special Segments in a Triangle
In this geometry worksheet, 10th graders review the vocabulary associated with the special segments of a triangle and the associated points of concurrency and solve problems in which they find the indicated missing angle or...
Curated OER
Earth's Rotation Changes and the Length of the Day
In this Earth's rotation and day length learning exercise, students are given a table with the period of geological time, the age of the Earth and the total days per year. Students calculate the number of hours per day in each geological...
Curated OER
SAT Problem Solving Practice Test
In this problem solving practice test, learners select the best answer from 4 choices to ten questions. Questions are word problems and cover a variety of topics.


