University of Wisconsin
Measuring Slope for Rain Gardens
The slope of the land is an important feature when considering the erosion that will occur. In this resource, which is part of a rain garden unit, learners calculate the slope of the proposed garden site. Even if you are not planning a...
Curated OER
Stars and Slopes
More of a math lesson than physics or space science, high schoolers take a set of data and plot it on a log-log coordinate system. The write-up for day two was never completed, but day one, "Stars and Slopes," is complex and cohesive....
Curated OER
Slope, Vectors, and Wind Pressure
A hands-on lesson using the TI-CBR Motion Detector to provide information to graph and analyze. The class uses this information to calculate the slope of motion graphs and differentiate scalar and vector quantities. There is a real-world...
Curated OER
Mathematical Analysis of Temperature Scales
Students use the point-slope formula to determine the relationship between the Celsius and Fahrenheit scales of temperature. They use a graphing calculator to determine the slope of the line between two points in each scale.
Curated OER
Mapping the Ocean Floor
Students construct and interpret a line graph of ocean floor depth and a bar graph comparing the height/depth of several well-known natural and man-made objects and places. In addition, they calculate the depth of two points using sonar...
Curated OER
Density of a Paper Clip Lab Review
Even though this assignment is brought to you by Physics Lab Online, it is best used as a math practice. Middle schoolers calculate the range, mean, mode, and median for a list of eight different paper clip densities. They analyze...
Curated OER
Scientists Track the Rising Tide
In this tracking the rising tide worksheet, students use the data in a graph showing the seal level change versus time from 1900 to 2000 to answer 3 questions about the rising tides. Students determine the slope of a line drawn from 1920...
Curated OER
Graphing Speed
For this graphing worksheet, students read about independent and dependant variables and learn how to determine speed from the slope of a position vs. time graph. This worksheet has 4 matching, 17 fill in the blank, and 2 problems to solve.
Cornell University
Constructing and Visualizing Topographic Profiles
Militaries throughout history have used topography information to plan strategies, yet many pupils today don't understand it. Scholars use Legos and a contour gauge to understand how to construct and visualize topographic profiles. This...
Curated OER
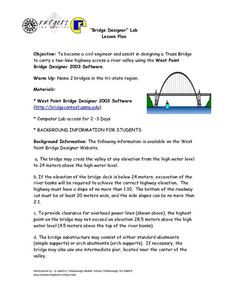
"Bridge Designer" Lab
Students become civil engineers and assist in designing a Truss Bridge to carry a two-lane highway across a river valley using the West Point Bridge Designer 2003 Software. They construct bridges based upon budget and demos. Students...
Curated OER
Red River Contours
In this contour map worksheet, students use a given contour map to answer 16 questions about the area shown on the map. Topics include the gradient from one spot to another, the elevation, the direction of the flow of the Red River, the...
Curated OER
Filling the Glass (Water, Air, and Fractions)
Students predict which of two glasses is 1/2 full using visual estimation, height measurement, and liquid measurement methods. Mathematical equations to accurately solve the problem are determined and verified.
Mr. E. Science
Motion
An informative presentation covers motion, metric system, conversions, graphing of coordinates and lines, speed, velocity, and acceleration problems, as well as mean calculations. This is the first lesson in a 26-part series.
Curated OER
Velocity and Acceleration
Compliment your physics lesson with this PowerPoint which demonstrates many important points regarding acceleration and velocity. A starter experiment activity to stimulate student thinking is given, and may prove very interesting to a...
Curated OER
Gilligan's Island
Students investigate topographical maps and match actual landforms to them. In this topographical maps lesson students create "Gilligan's Island" to scale then answer questions about it such as what the highest elevations is and...
Curated OER
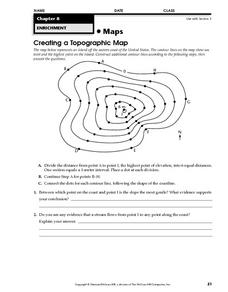
Creating a Topographic Map
In this topographic map worksheet, students add contour lines to a topographic map using instructions provided. Once topographic map is finished, students complete 2 follow-up short answer questions.
Curated OER
Earth's Rotation Changes and the Length of the Day
In this Earth's rotation and day length learning exercise, students are given a table with the period of geological time, the age of the Earth and the total days per year. Students calculate the number of hours per day in each geological...
Curated OER
Graphing Your Motion with Vernier LabQuests
Seventh graders create motion graphs using a motion sensor. In this physics lesson, 7th graders match the graph shown by moving their body. They relate the slope to the way they moved.
Curated OER
Describing the Motion of a Battery Powered Cars
Young scholars explore distance a toy car travels by changing the amount of batteries used to power the toy car. In this force and motion lesson, students calculate the average speed of a car while investigating the power from...
Curated OER
Beaches Trivia
In this beaches instructional activity, students complete sentences about the beach and land around it. Students complete 2 pages of sentences.
Michigan Sea Grant
Exploring Watersheds
Collaboratively, students partake in a hands-on activity in which they build models of a watershed. Each group member draws an elevation map—a bird's eye view—of their model and predicts how water will flow from the high to low points....
Curated OER
The Extraordinary Life of the Alaskan Tundra
Students investigate the characteristics of the tundra on the North Slope of Alaska. They conduct Internet research, develop a chart of the types of vegetation, plant growth, and fauna found on the tundra, identify examples in their own...
Curated OER
Getting Help, but for More Work?
Fifth graders discuss prior knowledge of slope and force. They relate steepness of slope to the force needed to get an object up the slope. Students read from their text the information about inclined planes. They answer the questions...
Curated OER
Mathematical Techniques - Basic Graphing
Students are introduced to significant figures and how to add, subtract, multiply and divide them. In a group, they practice plotting data points from a table to a graph and labeling all axes. They calculate the slope and y-intercept and...


