Curated OER
Speed
Fifth and sixth graders practice working in pairs to determine whether they can walk with constant speed. They test themselves, collect their data, draw graphs with their data collected, manipulate the data, and then draw conclusions...
Curated OER
Worksheet 3: Graphing Speed and Time
In this graphing speed and time worksheet, students answer 7 questions regarding graphing, speed, distance, derivatives, Newton's method and wheel radius.
Concord Consortium
Graphing Elements
How do you graph a sentence? Scholars do just that as they represent relationships between independent and dependent variables with a graphical representation. Given a sentence, they determine the pertinent relationship and create a...
Curated OER
Calculus 10.2 day 2 - Vector Valued Functions
Looking for a lesson on vectors? Here is a PowerPoint that has six examples for finding velocity, acceleration, speed and direction of motion. One of the examples demonstrates the use of the TI-89 Graphing Calculator to solve a problem.
Curated OER
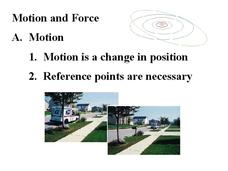
Motion and Force
All the main concepts in motion and force are covered in this presentation. Each slide is a great summary and will appeal to your students with a clean design and images that should seem relevant. Definitions of speed, displacement,...
CPO Science
Physics Skill and Practice Worksheets
Stop wasting energy searching for physics resources, this comprehensive collection of worksheets has you covered. Starting with introductions to the scientific method, dimensional analysis, and graphing data, these skills practice...
Corbett Maths
Average Rate of Change
Simply find the slope to find the average rate of change. A short video provides the definition of the average rate of change. Using the definition, pupils calculate the average rate of change to solve problems that cover finding average...
Curated OER
Don’t Sit Under the Apple Tree…You Might Become Famous
Students explore Newton's laws using CEENBoTs. In this physics lesson, students collect data and create tables and graphs. They calculate speed, acceleration and forces using mathematical formulas.
Edmond Public Schools
8th Grade Science Resource Book: Unit 2 - Physics
Get things moving with this extensive collection of physical science resources. Covering the fundamentals of measurement, graphing, lab safety, and experimental design as well as the specific scientific concepts of velocity,...
Balanced Assessment
Para-Ball-A
Analyze the flight of a thrown ball. Learners determine the maximum height of a thrown ball and the time it takes to hit the ground given its initial speed. They continue to review different scenarios with different maximums or different...
Flipped Math
Calculus AB/BC - Connecting a Function, Its First Derivative, and Its Second Derivative
Uncover what the first and second derivatives reveal about the function. Pupils move beyond sketching graphs to determine what derivatives tell about the function itself. The video reminds learners about particle motion and how to...
Alabama Learning Exchange
Investigating Friction
Young learners explore friction. They view a video or DVD (bibliography provided) and define terms related to friction, and work in groups to experiment with the effects of friction on speed and motion using ramps and toy cars.
Curated OER
Vectors: How Much Force Can You Apply
This activity entails the viewing of two videos to get an overview of force and its application. The activity covers how vectors use force in real-world situations.
Curated OER
Measuring the Speed of a Wave
Young scholars create an experiment in which they measure the speed of a wave and record the data in a graph. They work in small groups to write the procedure for the experiment and share it with another group for cross checking of the...
National Council of Teachers of Mathematics
Varying Motion
For this secondary mathematics learning exercise, high schoolers collect data based on a person’s motion. From this data, students create graphs comparing displacement, velocity, and acceleration to time. The five-page learning exercise...
Curated OER
TE Activity: Heavy Helicopters
Students study the concepts of weight and drag while making paper helicopters. They measure how adding more weight to the helicopter changes the time for the helicopter to fall to the ground. They apply what they examine to the work of...
Curated OER
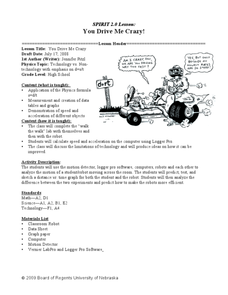
You Drive Me crazy
Students calculate the distance and acceleration of an object. In this algebra lesson, students collect data and create table and graphs to analyze it. They complete a lab as they collect and analyze data on acceleration and distance.
Curated OER
Mathematics Module
Delve into graphing! The concepts covered begin with basic graphing basic coordinates and algebraic expressions on coordinate planes, and build up to graphing linear inequalities and equations. Learners solve and simplify various...
NTTI
Vectors: Traveling, But in What Direction
High schoolers watch a video of real-world situations regarding speed, direction, velocity, force, etc. and answer questions while viewing. They then practice drawing and using vectors to solve more real-world problems.
Curated OER
Graphs
Students list their favorite cars and create graphs of their favorites. Students determine how the graphs would change as their choices change.
Curated OER
Worksheet 14
In this math worksheet, pupils analyze a path around a circle. The interval is defined. Students sketch a graph of a given parametric curve. Five application problems give pupils practice using these concepts in real life situations.
Curated OER
Vectors: Follow That Arrow
Vectors and their connection to motion. A video will be presented to provide information for the class to use methods of solving vectors with and without grids. Real-world physical concepts will be explored in reference to vectors.
Curated OER
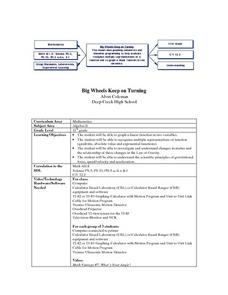
Big Wheels Keep on Turning
Eleventh graders work in groups and investigate how force determines the speed and distance then they view the video, "Math Vantage #7: What's Your Angle?." They are given a real life problem to solve using speed, ramps, angle, incline...
Curated OER
Hit and Run
Pupils explore data collection in this lesson. They investigate distance vs. time and velocity vs. time graphs using information collected with a CBR 2 to simulate the reconstruction of an accident.


