Inside Mathematics
Archery
Put the better archer in a box. The performance task has pupils compare the performance of two archers using box-and-whisker plots. The resource includes sample responses that are useful in comparing individuals' work to others.
Noyce Foundation
Ducklings
The class gets their mean and median all in a row with an assessment task that uses a population of ducklings to work with data displays and measures of central tendency. Pupils create a frequency chart and calculate the mean and median....
EngageNY
Federal Income Tax
Introduce your class to the federal tax system through an algebraic lens. This resource asks pupils to examine the variable structure of the tax system based on income. Young accountants use equations, expressions, and inequalities to...
Curated OER
Pizza! Pizza!
Third graders tally, sort, and organize pizza orders from monthly school sales. They create an advertising campaign to promote the School Pizza Sale, record the data in graph form, compare and contrast the tallies throughout the year,...
Curated OER
A Model Solar System
If Earth is modeled by a grapefruit, what planet could be represented by a golf ball? This activity uses everyday and not-so-everyday objects to create a model of the Solar System.
Noyce Foundation
Percent Cards
Explore different representations of numbers. Scholars convert between fractions, decimals, and percents, and then use these conversions to plot the values on a horizontal number line.
Inside Mathematics
Aaron's Designs
Working with transformations allows the class to take a turn for the better. The short assessment has class members perform transformations on the coordinate plane. The translations, reflections, and rotations create pattern designs on...
Curated OER
The Right Time
Middle schoolers compute and estimate using mental mathematics, paper-and-pencil methods, calculators, and computers. They measure and compare quantities using appropriate units, instruments and methods. They utilize worksheets imbedded...
Curated OER
Healthy Hearts
Pupils research the basic concepts of heart health and disease and become an expert in an area as it relates to the heart and circulatory system. They prepare a multimedia presentation of their findings.
Curated OER
What is Life?
Students investigate living and non-living organisms/objects foudn around the school in this technology-based science lesson. Adjustments to the lesson can be made based upon technological limitations.
Curated OER
Shaquille O'Neal Hand/Foot Span
Eighth graders measure foot length and hand span in this experiment to determine the ratio. They apply the ratio to determine Shaquille O'Neal's hand span if given his shoe size.
Curated OER
Charting Seasonal Changes
Students research the Earth's patterns of rotation and revolution, create a chart and graph of these patterns and use them to explain the causes of night and day and summer and winter.
Curated OER
Getting It Right!
Young scholars construct right triangles, measuring the sides and recording the measurements in spreadsheets. They analyze their measurements for patterns and research the Internet for information on Pythagoras.
Curated OER
Student Census
Students collect data from their peers and store the information in a database. As students manage the information they realize the usefulness of a database as a tool to manage large amounts of information in an efficient and accurate...
Curated OER
Pumped Up Gas Prices
Students calculate gas prices. In this transportation lesson plan, students tally the mileage and gas costs of their car for one months. They figure out how much was spent on gas and create a graph showing average gas prices over time.
Curated OER
When Dinosaurs Ruled the World
Students graph the varying sizes of dinosaurs. In this math and dinosaur lesson, students view dinosaur models and compare the different shapes and sizes of the dinosaurs. Students complete a dinosaur math activity, read The Dinosaur...
Curated OER
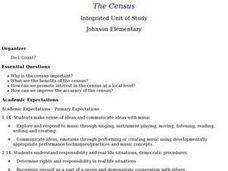
The Census
Learners analyze why the census is important and the benefits of it. Determine rights and responsibilities in real life situations. They are divided into groups and take a mock census of a list of teachers and students each. Results of...
Curated OER
Lesson 3: Seven Day Road Trip
Students plan a seven day road trip. For this travel lesson, students plan a driving trip that includes five major cities or attractions in Florida or another state of their choice. They show the trip on a map, calculate distances that...
Curated OER
Graphing Using Excel
Fifth graders complete a series of graphs by gathering information and using Excel to graph the information. In this graphing lesson, 5th graders graph favorite desserts of the class. Student put their results into the computer and then...
Curated OER
Employee Payroll Simulation
Learners simulate creating and calculating employees payrolls using hourly wages, deductions, and proper taxes.
Alabama Learning Exchange
Watch That Plant Grow
Middle schoolers examine the growth of marigolds in a greenhouse environment. They chart data in spreadsheets showing plant growth over time and under a number of conditions. They record measures of plant height and greenhouse temperature.
Curated OER
Modeling the Keeling Curve with Excel
In this modeling the Keeling Curve worksheet, students use given data beginning in 1960 to create a mathematical model for the changes in atmospheric carbon dioxide over time. Students manipulate the equation to predict the carbon...
Curated OER
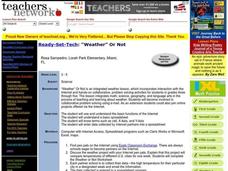
Weather Or Not
Students use the internet to find pen pals to share in their weather experiment. Individually, they research the high and low temperatures for cities within the United States and email the results to their pen pal. They also develop a...
Curated OER
Music With a Message
Students write a line by line analysis of a song which they feel expresses a powerful message that can change society for the better. They then present their analysis to the class in an oral report.


